|
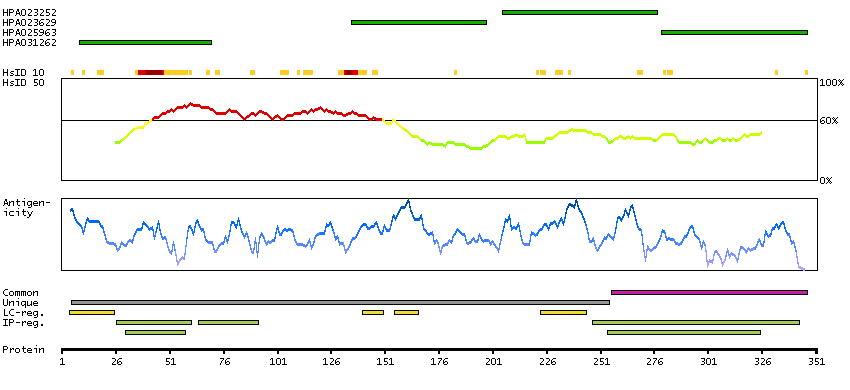
Antibody HPA023252
|
|
Antibody HPA023629
|
|
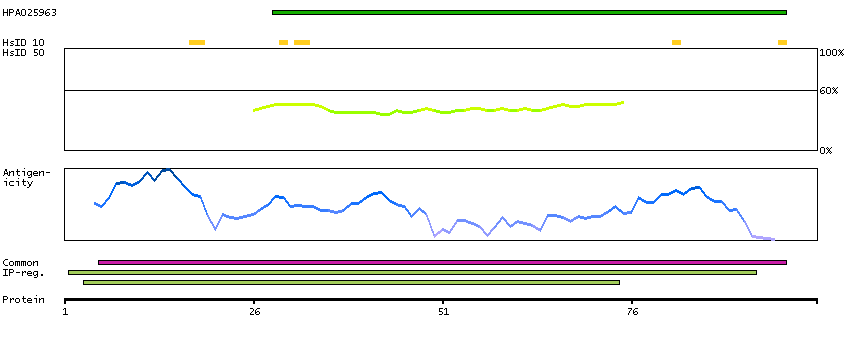
Antibody HPA025963
|
|
Antibody HPA031262
|
|
Antibody CAB068208
|
|
Antibody CAB068209
|
|
Antibody CAB068210
|
|
|
ANTIBODY INFORMATION
|
|
Provider |
Atlas Antibodies
Sigma-Aldrich
| | Atlas Antibodies
Sigma-Aldrich
| | Atlas Antibodies
Sigma-Aldrich
| | Atlas Antibodies
Sigma-Aldrich
| | Atlas Antibodies
Sigma-Aldrich
| | Atlas Antibodies
Sigma-Aldrich
| | Atlas Antibodies
Sigma-Aldrich
| |
Product name |
HPA023252 | | HPA023629 | | HPA025963 | | HPA031262 | | AMAb90798 | | AMAb90800 | | AMAb90801 | |
Host species |
Rabbit | | Rabbit | | Rabbit | | Rabbit | | Mouse | | Mouse | | Mouse | |
Clonality |
pAb | | pAb | | pAb | | pAb | | mAb | | mAb | | mAb | |
Purity |
Affinity purified using the PrEST-antigen as affinity ligand | | Affinity purified using the PrEST-antigen as affinity ligand | | Affinity purified using the PrEST-antigen as affinity ligand | | Affinity purified using the PrEST-antigen as affinity ligand | | Protein A/G | | Protein A/G | | Protein A/G | |
Released in version |
5 | | 5 | | 5 | | 12 | | 13 | | 13 | | 13 | |
|
ANTIGEN INFORMATION
|
|
Antigen |
Recombinant protein fragment | | Recombinant protein fragment | | Recombinant protein fragment | | Recombinant protein fragment | | Recombinant protein | | Recombinant protein | | Recombinant protein | |
Length (aa) |
73 | | 64 | | 69 | | 62 | | | | | | | |
Antigen sequence |
PGLLEEDNQWMTQINRLQKLIDRLEKKDLKLEPPEEEIIEGNTKSHIMLV
QRQMSVIEEDLEEFQLALKHYVE
| | LLKETLNQLQSLQNSLECAMETTEEQTRQERQGPAKPEVLSIQWPGKRSS
RRVQRHNSFSPNSP
| | ASSQSGCLRISIQKLSNESRYMIYEFWENSSVWNSHLQTNYSKTFQRSNV
DFLETPELTSTMLVPASWW
| | PSSNNSSEELSSALHLSKGMSIFLDILRRADKNDDGKLSFEEFKAYFADG
VLSGEELHELFH
| |
| |
| |
| |
Matching transcripts |
NECAB1-001 - ENSP00000387380 [100%]
| | NECAB1-001 - ENSP00000387380 [100%]
| | NECAB1-001 - ENSP00000387380 [100%]
NECAB1-003 - ENSP00000428632 [100%]
NECAB1-007 - ENSP00000428953 [100%]
| | NECAB1-001 - ENSP00000387380 [100%]
| | | | | | | |
Other gene match |
| | | | | | | | | | | | | |
|
ANTIBODY VALIDATION
|
|
|
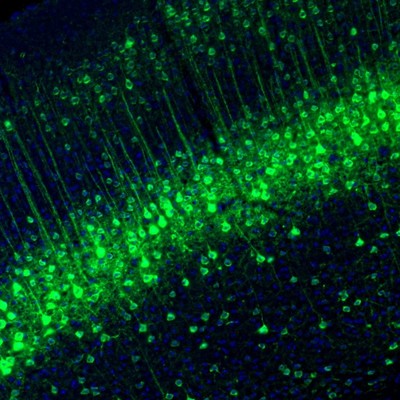
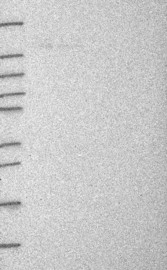
Mouse brain
|
|
Image |
| | 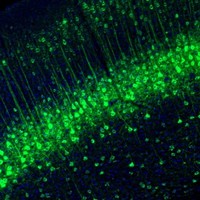 | | | | | | | | | | | |
Description |
Application not done for this antibody. | | Subsets of neurons showed distinct positivity in cell bodies and dendrites. Main location of the positive neurons are layer 4 of the cerebral cortex.
More information | | Application not done for this antibody. | | Application not done for this antibody. | | Application not done for this antibody. | | Application not done for this antibody. | | Application not done for this antibody. | |
Validation MB |
| | Supportive | | | | | | | | | | | |
|
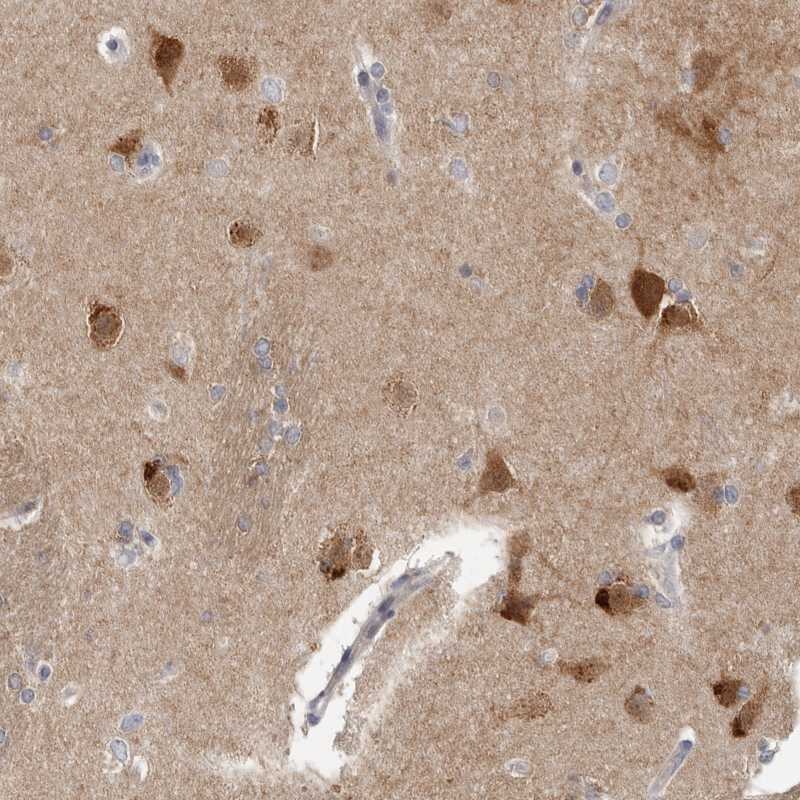
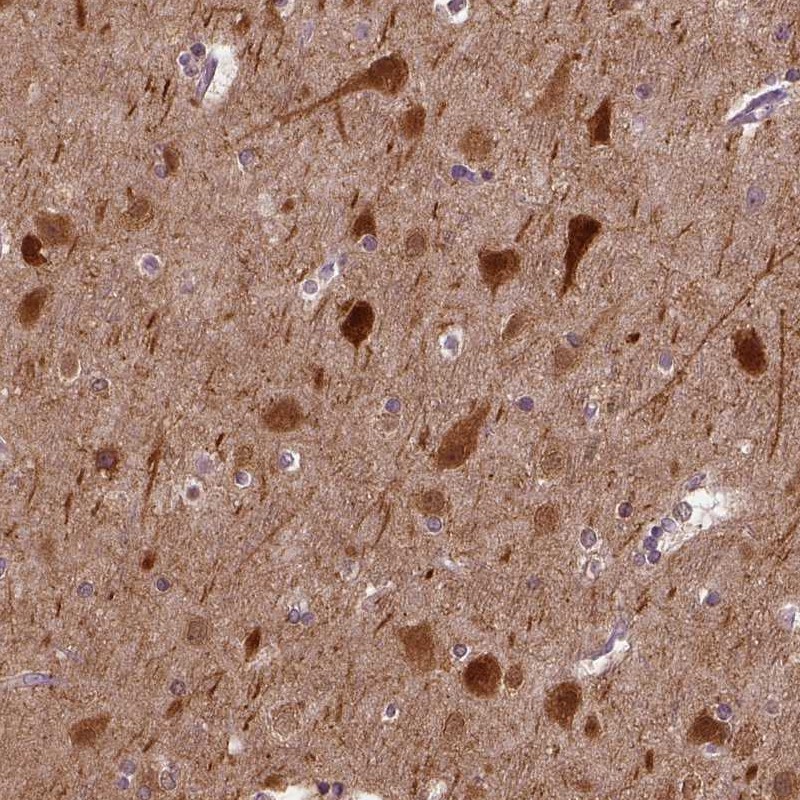
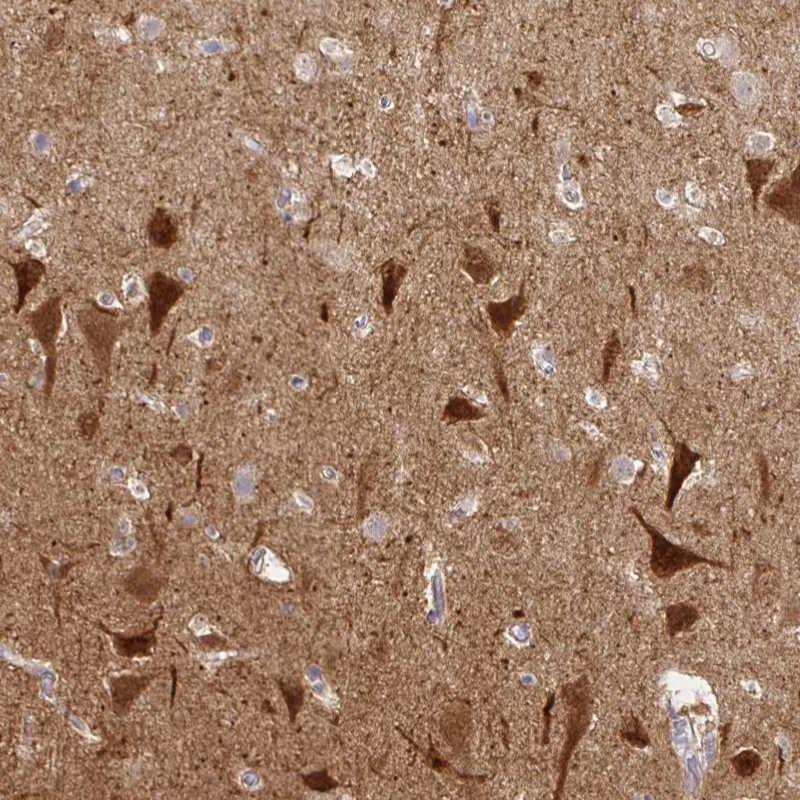
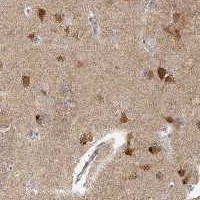
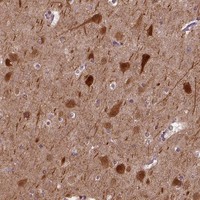
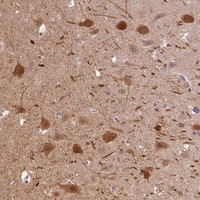
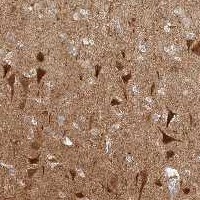
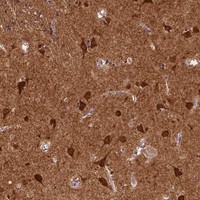
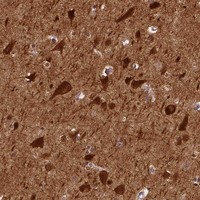
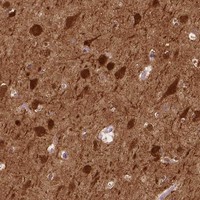
Immunohistochemistry
|
|
Image |
 | |  | |  | |  | |  | |  | |  | |
Description |
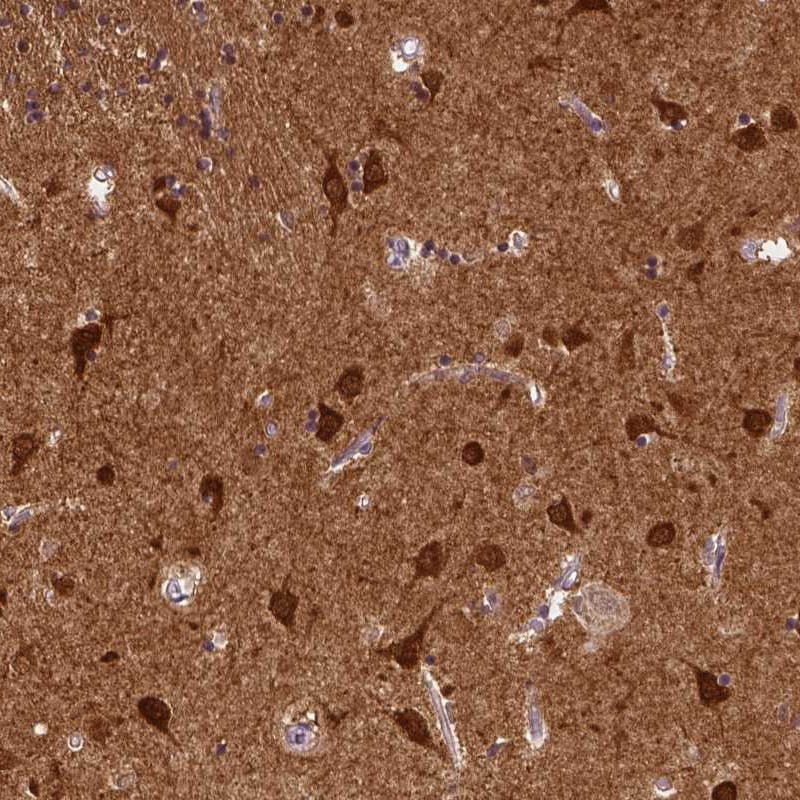
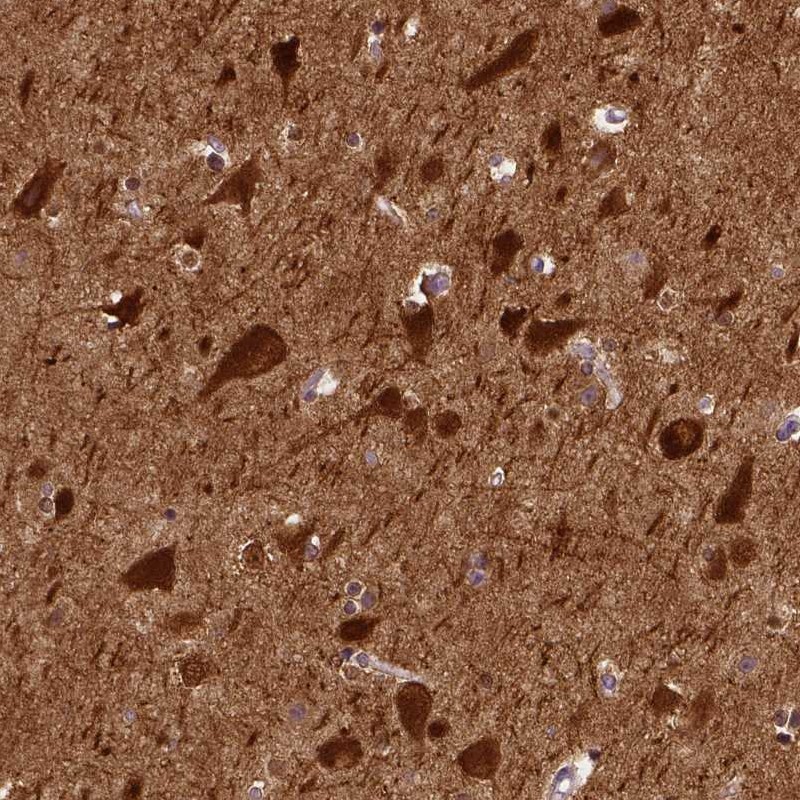
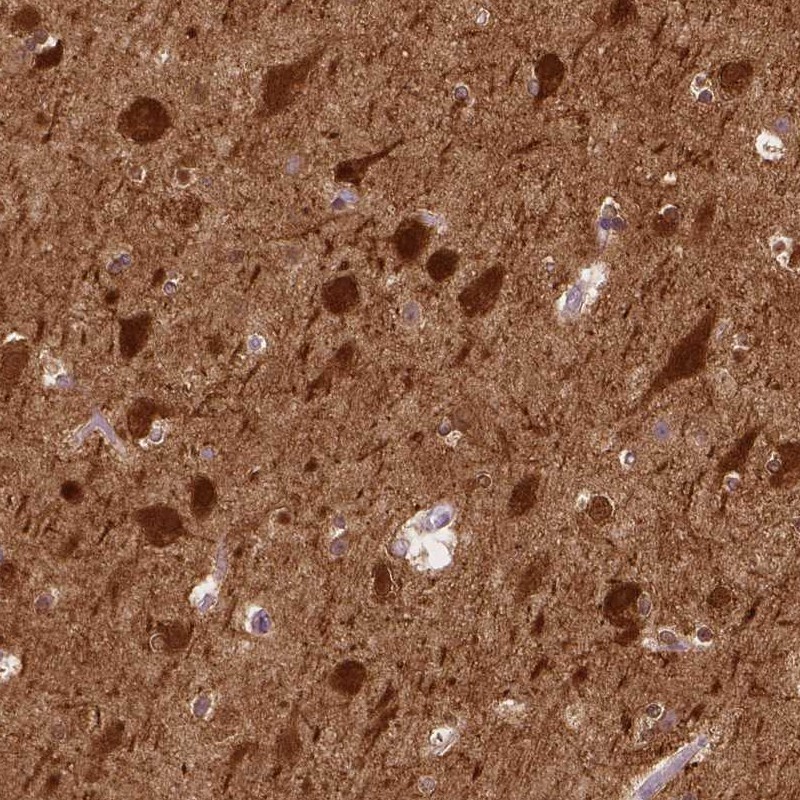
Immunohistochemical staining of human lateral ventricle shows strong cytoplasmic positivity in neuronal cells.
More information | | Immunohistochemical staining of human cerebral cortex shows moderate cytoplasmic and nuclear positivity in neuronal cells.
More information | | Immunohistochemical staining of human hippocampus shows moderate cyoplasmic and nuclear positivity in neuronal cells.
More information | | Immunohistochemical staining of human cerebral cortex shows strong cytoplasmic positivity in neuronal cells.
More information | | Immunohistochemical staining of human lateral ventricle shows strong cytoplasmic and nuclear positivity in neuronal cells.
More information | | Immunohistochemical staining of human cerebral cortex shows strong cytoplasmic and nuclear positivity in neuronal cells.
More information | | Immunohistochemical staining of human cerebral cortex shows strong positivity in neuronal cells.
More information | |
Retrieval method |
HIER pH6 | | HIER pH6 | | HIER pH6 | | HIER pH6 | | HIER pH6 | | HIER pH6 | | HIER pH6 | |
Antibody dilution |
1:150 | | 1:1200 | | 1:200 | | 1:800 | | 1:7000 | | 1:7000 | | 1:7000 | |
Literature conformity |
Consistent with gene/protein characterization data | | Consistent with gene/protein characterization data | | Consistent with gene/protein characterization data | | Consistent with gene/protein characterization data | | Consistent with gene/protein characterization data | | Consistent with gene/protein characterization data | | Consistent with gene/protein characterization data | |
RNA consistency |
Consistent with RNA expression data | | Mainly consistent with RNA expression data | | Mainly consistent with RNA expression data | | Mainly consistent with RNA expression data | | Mainly consistent with RNA expression data | | Mainly consistent with RNA expression data | | Mainly consistent with RNA expression data | |
|
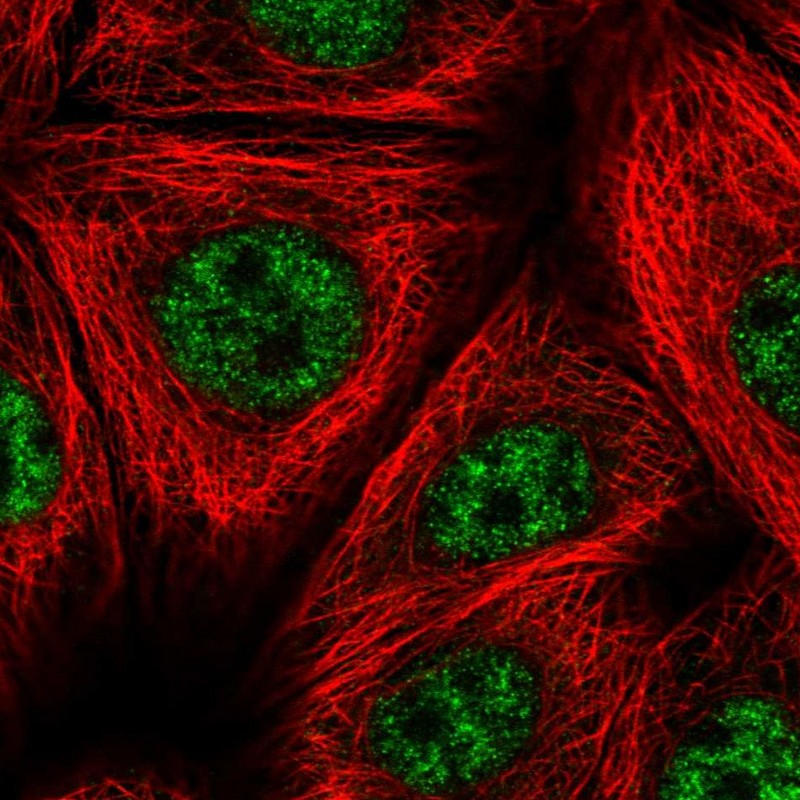
Immunofluorescence
|
|
Image |
 | | | |  | |  | | | | | | | |
Description |
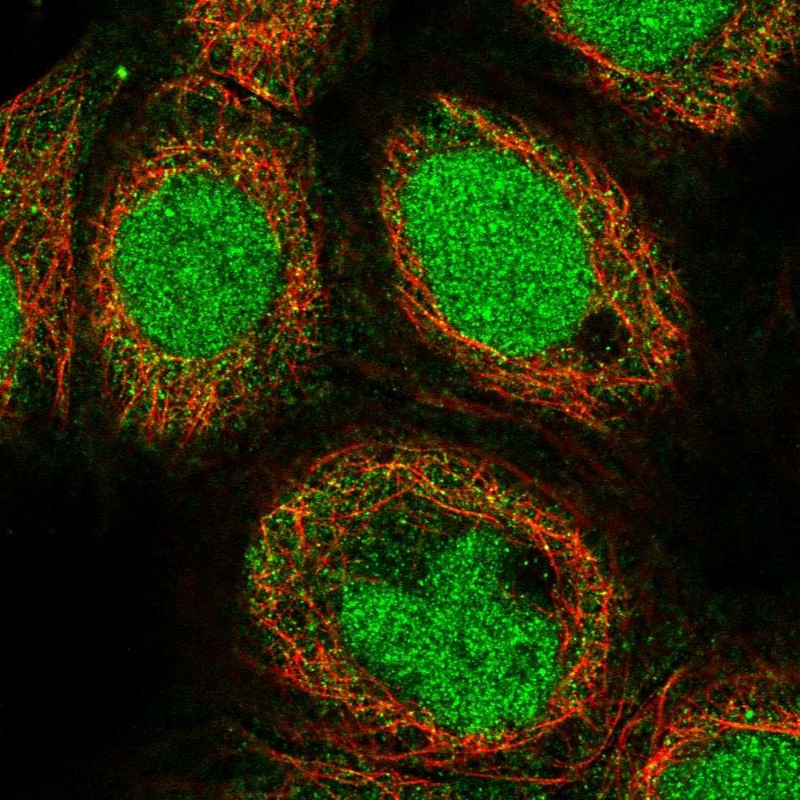
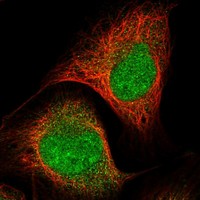
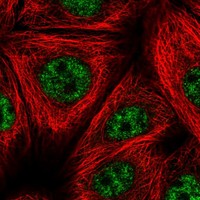
Immunofluorescent staining of human cell line A-431 shows positivity in nucleus & cytoplasm.
More information | | Application not done for this antibody. | | Immunofluorescent staining of human cell line U-2 OS shows positivity in cytoplasm & nucleus but excluded from the nucleoli.
More information | | Immunofluorescent staining of human cell line MCF7 shows positivity in nucleus but excluded from the nucleoli.
More information | | Application not done for this antibody. | | Application not done for this antibody. | | Application not done for this antibody. | |
Antibody dilution |
1:50 | | | | 1:7 | | 1:141 | | | | | | | |
Validation IF |
Supportive: The subcellular location is supported by experimental gene/protein characterization data, gene silencing, or an independent antibody. | | | | Supportive: The subcellular location is supported by experimental gene/protein characterization data, gene silencing, or an independent antibody. | | Uncertain: The subcellular location is partly supported by experimental gene/protein characterization data, or no such data is available. | | | | | | | |
|
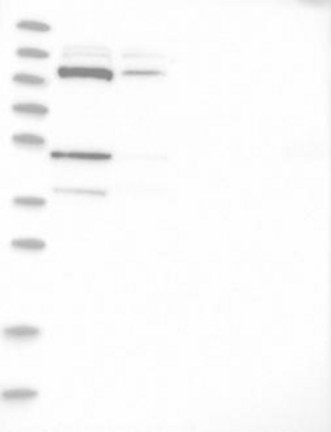
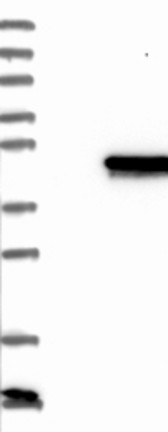
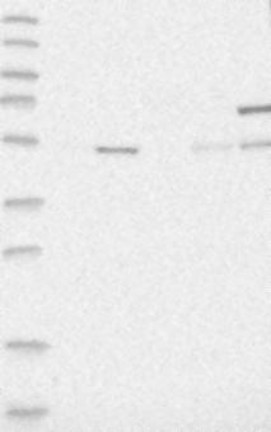
Western Blot
|
|
Image |
 | |  | |  | |  | |  | |  | |  | |
Description |
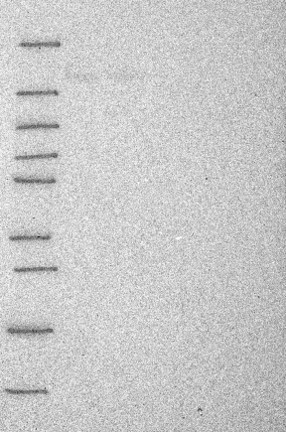
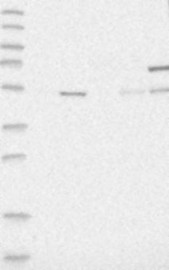
Lane 1: Marker [kDa] 250, 130, 95, 72, 55, 36, 28, 17, 10
Lane 2: Negative control (vector only transfected HEK293T lysate)
Lane 3: Over-expression Lysate (Co-expressed with a C-terminal myc-DDK tag (~3.1 kDa) in mammalian HEK293T cells, LY411679)
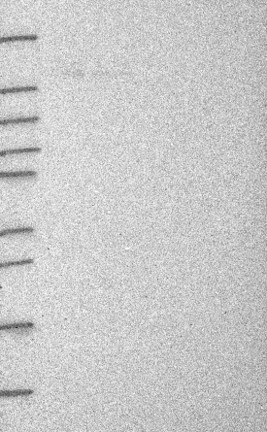
More information | | Lane 1: Marker [kDa] 230, 130, 95, 72, 56, 36, 28, 17, 11
Lane 2: RT4
Lane 3: U-251 MG
Lane 4: Human Plasma
Lane 5: Liver
Lane 6: Tonsil
More information | | Lane 1: Marker [kDa] 250, 130, 95, 72, 55, 36, 28, 17, 10
Lane 2: Negative control (vector only transfected HEK293T lysate)
Lane 3: Over-expression Lysate (Co-expressed with a C-terminal myc-DDK tag (~3.1 kDa) in mammalian HEK293T cells, LY411679)
More information | | Lane 1: Marker [kDa] 230, 130, 95, 72, 56, 36, 28, 17, 11
Lane 2: RT4
Lane 3: U-251 MG
Lane 4: Human Plasma
Lane 5: Liver
Lane 6: Tonsil
More information | | Lane 1: Marker [kDa] 250, 130, 100, 70, 55, 35, 25, 15, 10
Lane 2: RT4
Lane 3: U-251 MG
Lane 4: Human Plasma
Lane 5: Liver
Lane 6: Tonsil
More information | | Lane 1: Marker [kDa] 250, 130, 100, 70, 55, 35, 25, 15, 10
Lane 2: RT4
Lane 3: U-251 MG
Lane 4: Human Plasma
Lane 5: Liver
Lane 6: Tonsil
More information | | Lane 1: Marker [kDa] 250, 130, 100, 70, 55, 35, 25, 15, 10
Lane 2: RT4
Lane 3: U-251 MG
Lane 4: Human Plasma
Lane 5: Liver
Lane 6: Tonsil
More information | |
Target mass (kDa) |
40.6 | | 40.6 | | 40.6, 11.8 | | 40.6 | | 40.6, 11.8 | | 40.6, 11.8 | | 40.6, 11.8 | |
Antibody dilution |
1:250 | | 1:250 | | 1:250 | | 1:250 | | 1:1000 | | 1:1000 | | 1:1000 | |
Validation WB |
Supportive: Band of predicted size in kDa (+/-20%) with additional bands present | | Supportive: Band of predicted size in kDa (+/-20%) with additional bands present | | Supportive: Single band corresponding to the predicted size in kDa (+/-20%) | | Supportive: Band of predicted size in kDa (+/-20%) with additional bands present | | Uncertain: Single band differing more than +/-20% from predicted size in kDa and not supported by experimental and/or bioinformatic data | | Uncertain: Single band differing more than +/-20% from predicted size in kDa and not supported by experimental and/or bioinformatic data | | Uncertain: No bands detected | |
|
Protein array
|
|
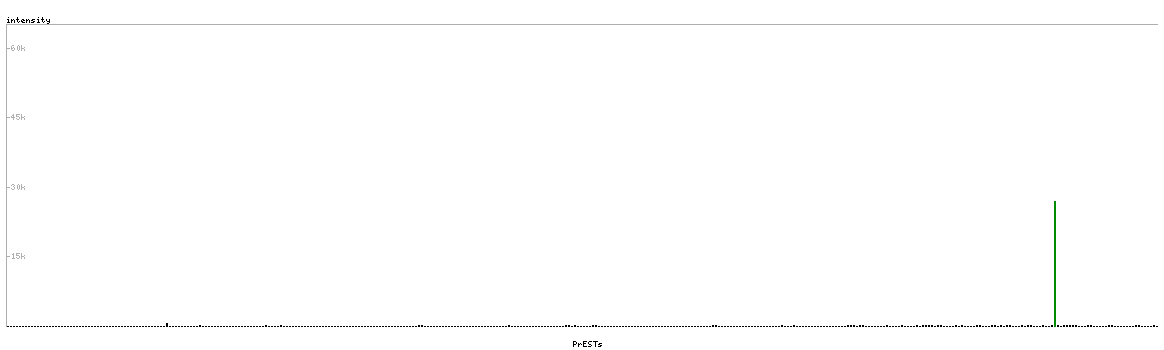
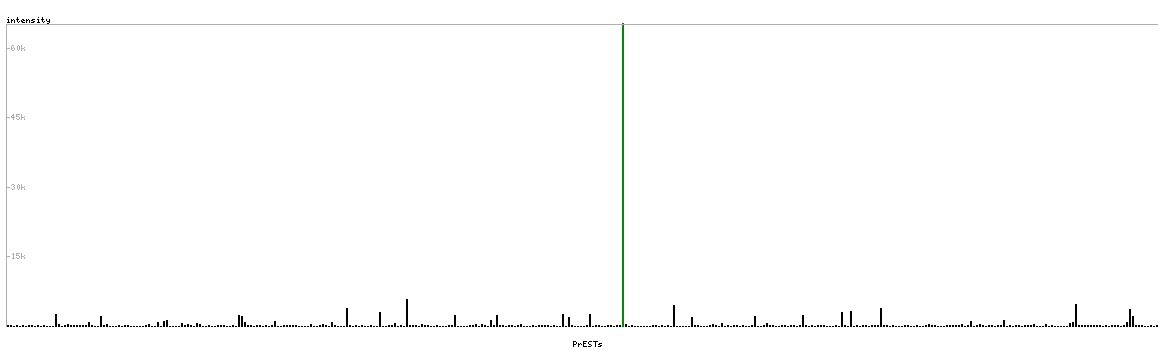
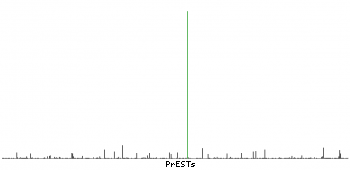
Image |
 | |  | |  | |  | | | | | | | |
Description |
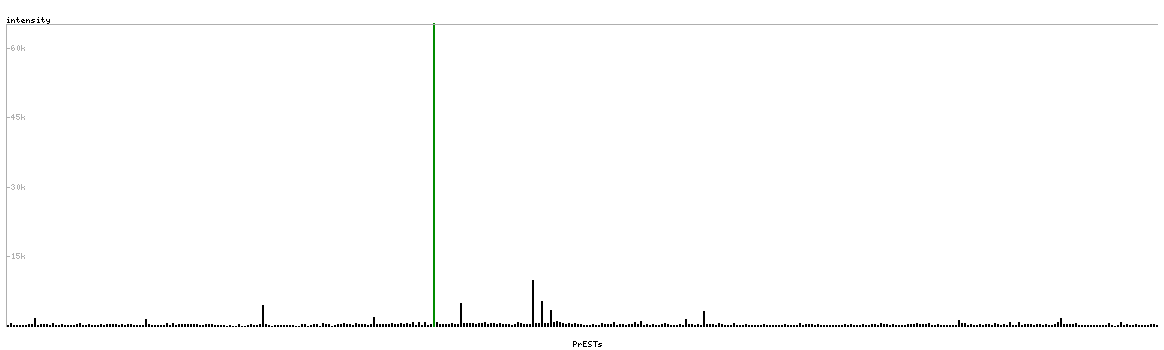
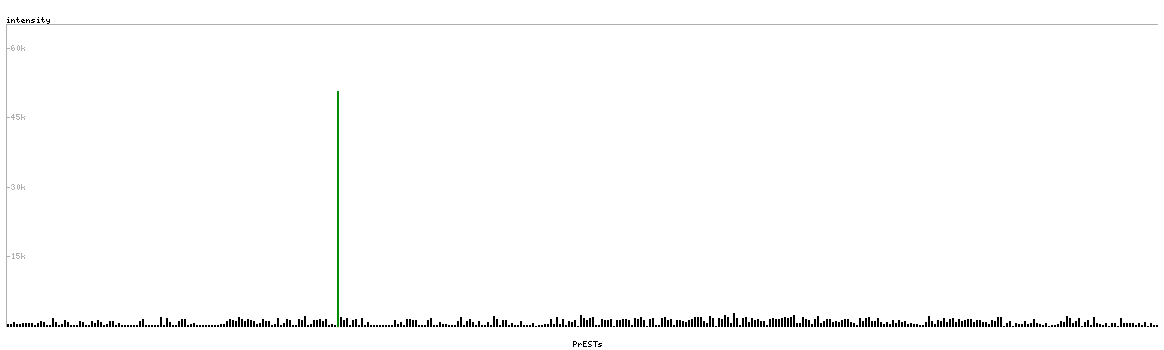
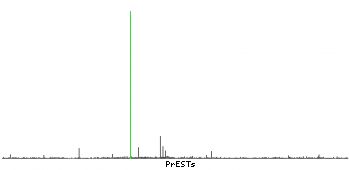
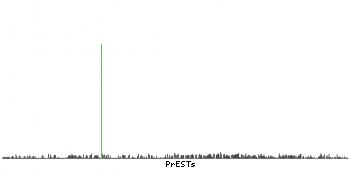
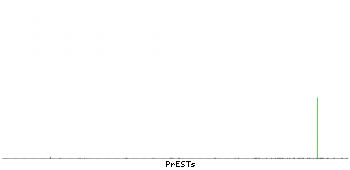
Antibody specificity analysis with protein arrays. Predicted and matching interactions are shown in green.
More information | | Antibody specificity analysis with protein arrays. Predicted and matching interactions are shown in green.
More information | | Antibody specificity analysis with protein arrays. Predicted and matching interactions are shown in green.
More information | | Antibody specificity analysis with protein arrays. Predicted and matching interactions are shown in green.
More information | | Application not done for this antibody. | | Application not done for this antibody. | | Application not done for this antibody. | |
Antibody dilution |
1:3000 | | 1:3000 | | 1:500 | | 1:12000 | | | | | | | |
Validation PA |
Uncertain: Pass with quality comment low specificity (binding to 1-2 PrESTs >15% and <40%). | | Supportive: Pass with single peak corresponding to interaction only with its own antigen. | | Supportive: Pass with single peak corresponding to interaction only with its own antigen. | | Supportive: Pass with single peak corresponding to interaction only with its own antigen. | | | | | | | |
| |