The proteome of bone marrow and lymphatic tissues
|
Lymphatic tissues are divided into primary and secondary depending upon the stage of lymphocyte development and maturation it is involved in. In the adult, the bone marrow constitutes the primary lymphatic tissue involved in the production and early selection of both T- and B-lymphocytes. The adult bone marrow also includes cell lineages responsible for production of erythrocytes, leukocytes, and thrombocytes. The spleen and lymph nodes form encapsulated secondary lymphatic tissues, hosting mature although naïve lymphocytes, and constituting an environment for antigen detection and initiation of an adaptive immune response. Non-encapsulated lymphatic nodules are usually located in regions underlying epithelial membranes in tissues subjected to frequent exposure to microorganisms, including the digestive system, respiratory system, and urinary bladder. Most prominent lymphatic nodules are found in the appendix.
The transcriptome analysis shows that 71% of all human proteins (n=19692) are expressed in at least one of the four tissues included here. 801 of these genes show an elevated expression in bone marrow and lymphatic tissues compared to other tissue types. The function of these proteins that are specifically elevated in the lymphatic and bone marrow tissues are well in line with the features and functions of the different anatomical and functional regions of the bone marrow and secondary lymphoid organs, and include proteins involved in immune system processes and defense response.
The following analyses are based on samples from normal human bone marrow, lymph node, spleen, and appendix. These four tissues are in all following texts and figures denoted as BMLT (bone marrow and lymphatic tissues).
|
- 801 genes defined as elevated in the BMLT
- Most of the elevated genes in BMLT encode proteins involved in immune system processes and defense response
- The highest levels of expression are found for genes defined as enriched in bone marrow (n=84)
- Most genes enriched in bone marrow encode proteins that are involved in defense against other organisms
|
Figure 1. The distribution of all genes across the five categories based on transcript abundance in BMLT as well as in all other tissues.
The four categories of genes with elevated expression in BMLT compared to other organs are shown in Table 1.
Table 1. The genes with elevated expression in BMLT.
Category |
Tissue |
Number of genes |
Description |
| Tissue enriched |
bone marrow |
84 |
At least five-fold higher mRNA levels in bone marrow |
| lymph node |
0 |
At least five-fold higher mRNA levels in lymph node |
| spleen |
8 |
At least five-fold higher mRNA levels in spleen |
| appendix |
2 |
At least five-fold higher mRNA levels in appendix |
| Group enriched |
|
123 |
Higher mRNA levels in a group of tissues including at least one BMLT tissue |
| Tissue enhanced |
|
584 |
At least five-fold higher mRNA levels in a particular tissue as compared to average levels in all tissues |
| Total |
|
801 |
Total number of elevated genes in BMLT |
The list of elevated genes (n=801) are well in line with the function of these tissues, as it includes an overrepresentation of proteins associated with immune system processes and defense response. 94 genes are found to be tissue enriched in one of the four lymphatic tissues. The total number of tissue-enriched genes in bone marrow is 84, whereas the amount of tissue enriched genes in spleen (8), lymph node (0) and appendix (2) are substantially lower. 48 of the 123 group enriched genes have higher mRNA levels in a group of tissues including more than one BMLT tissue.
The transcriptome of BMLT
An analysis of the expression levels of each gene makes it possible to calculate the relative mRNA pool for each of the categories. The analysis shows that 79% of the mRNA molecules in BMLT correspond to housekeeping genes and only 14% of the mRNA pool corresponds to genes categorized to be elevated in at least one of the BMLT tissues.
Global comparison of transcript profiles in BMLT
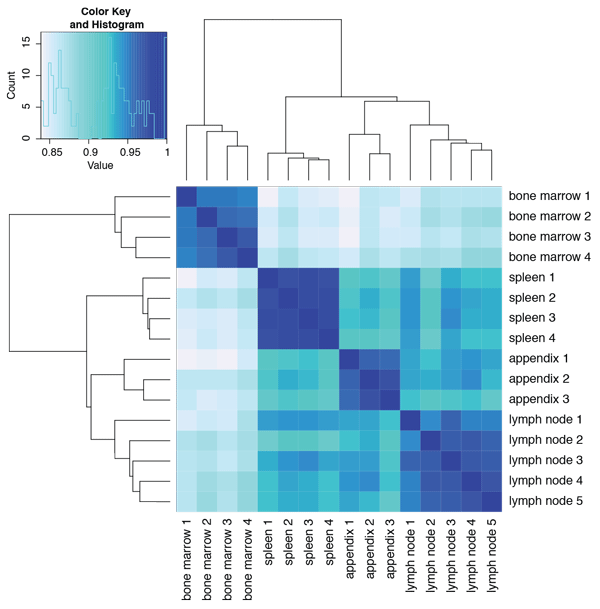
Comparing the overall transcript profiles of bone marrow, lymph node, spleen, and appendix, it is clear that bone marrow tissue displays a profile that is distinct from the other three tissues types. The hierarchical clustering based on correlation shown in Figure 2 shows that the three secondary lymphatic organs cluster together, whereas bone marrow deviates. The two most similar organs are the lymph node and appendix.
All four tissues are described in more detail on individual pages: bone marrow, lymph node, spleen, and appendix.
Figure 2. Hierarchical clustering of bone marrow, lymph node, spleen, and appendix based on their respective gene expression profiles as assessed using RNAseq. One to five biological replicates were analyzed for each tissue type.
Inflammatory cells are spread throughout the body
Immune cells are also naturally occurring in many other peripheral tissues. In the images, the presence of B-lymphocytes is visualized in both lymphatic and non-lymphatic tissues using an antibody targeting the MS4A1 (CD20) protein. The protein CD20 encoded by the MS4A1 gene is an activated-glycosylated phosphoprotein expressed on the surface of B-cells beginning at the pro-B phase with progressively increasing concentrations until maturity.
Genes shared between the BMLT and other tissues
There are 123 group-enriched genes expressed in the BMLT. Group-enriched genes are defined as genes showing a 5-fold higher average level of mRNA expression in a group of 2-7 tissues, including at least one tissue of the BMLT, compared to all other tissues.
In order to illustrate the relation of the four BMLT tissues to each other as well as to other tissues, a network plot was generated, displaying the number of commonly expressed genes between different tissue types.
Figure 3. An interactive network plot of the BMLT enriched and group enriched genes connected to their respective enriched tissues (grey circles). Red nodes represent the number of BMLT enriched genes and orange nodes represent the number of genes that are group enriched. The sizes of the red and orange nodes are related to the number of genes displayed within the node. Each node is clickable and results in a list of all enriched genes connected to the highlighted edges. The network is limited to group enriched genes in combinations of up to 5 tissues, but the resulting lists show the complete set of group enriched genes in the particular tissue.
The network plot shows that 21 genes are shared between the three organs with a major component of lymphoid cells, namely spleen, tonsil and appendix. Only 2 genes are shared between all four. Bone marrow and appendix share an enriched expression of 5 genes.
Background
Here, the protein-coding genes expressed in the BMLT are described and characterized, together with examples of immunohistochemically stained tissue sections that visualize protein expression patterns of proteins that correspond to genes with elevated expression in the BMLT.
Transcript profiling and RNA-data analyses based on normal human tissues have been described previously (Fagerberg et al., 2013). Analyses of mRNA expression including over 99% of all human protein-coding genes was performed using deep RNA sequencing of 124 individual samples corresponding to 32 different human normal tissue types. RNA sequencing results of 16 fresh frozen tissues representing normal BMLT was compared to 108 other tissue samples corresponding to 28 tissue types, in order to determine genes with elevated expression in BMLT. A tissue-specific score, defined as the ratio between mRNA levels in BMLT compared to the mRNA levels in all other tissues, was used to divide the genes into different categories of expression.
These categories include: genes with elevated expression in BMLT, genes expressed in all tissues, genes with a mixed expression pattern, genes not expressed in BMLT, and genes not expressed in any tissue. Genes with elevated expression in BMLT were further sub-categorized as i) genes with enriched expression in BMLT, ii) genes with group enriched expression including BMLT and iii) genes with enhanced expression in BMLT.
Human tissue samples used for protein and mRNA expression analyses were collected and handled in accordance with Swedish laws and regulation and obtained from the Department of Pathology, Uppsala University Hospital, Uppsala, Sweden as part of the sample collection governed by the Uppsala Biobank. All human tissue samples used in the present study were anonymized in accordance with approval and advisory report from the Uppsala Ethical Review Board.
Relevant links and publications
Uhlén et al (2015). Tissue-based map of the human proteome. Science
PubMed: 25613900 DOI: 10.1126/science.1260419
Yu et al (2015). Complementing tissue characterization by integrating transcriptome profiling from the Human Protein Atlas and from the FANTOM5 consortium. Nucleic Acids Res.
PubMed: 26117540 DOI: 10.1093/nar/gkv608
Fagerberg et al (2014). Analysis of the human tissue-specific expression by genome-wide integration of transcriptomics and antibody-based proteomics. Mol Cell Proteomics.
PubMed: 24309898 DOI: 10.1074/mcp.M113.035600
Histology dictionary