|
Antibody HPA038460
|
|
Antibody HPA038461
|
|
Antibody CAB075750
|
|
Antibody CAB075751
|
|
Antibody CAB075752
|
|
Antibody CAB075753
|
|
Antibody CAB075754
|
|
|
ANTIBODY INFORMATION
|
|
Provider |
Atlas Antibodies
Sigma-Aldrich
| | Atlas Antibodies
Sigma-Aldrich
| | Atlas Antibodies
Sigma-Aldrich
| | Atlas Antibodies
Sigma-Aldrich
| | Atlas Antibodies
Sigma-Aldrich
| | Atlas Antibodies
Sigma-Aldrich
| | Atlas Antibodies
Sigma-Aldrich
| |
Product name |
HPA038460 | | HPA038461 | | AMAb91005 | | AMAb91006 | | AMAb91007 | | AMAb91008 | | AMAb91009 | |
Host species |
Rabbit | | Rabbit | | Mouse | | Mouse | | Mouse | | Mouse | | Mouse | |
Clonality |
pAb | | pAb | | mAb | | mAb | | mAb | | mAb | | mAb | |
Purity |
Affinity purified using the PrEST-antigen as affinity ligand | | Affinity purified using the PrEST-antigen as affinity ligand | | Protein A/G | | Protein A/G | | Protein A/G | | Protein A/G | | Protein A/G | |
Released in version |
10 | | 10 | | 14 | | 14 | | 14 | | 14 | | 14 | |
|
ANTIGEN INFORMATION
|
|
Antigen |
Recombinant protein fragment | | Recombinant protein fragment | | Recombinant protein | | Recombinant protein | | Recombinant protein | | Recombinant protein | | Recombinant protein | |
Length (aa) |
91 | | 100 | | | | | | | | | | | |
Antigen sequence |
LDWSHNFTNMLGYTDHQFTELTRLYLTIHSDHEGGNVSAHTSHLVGSALS
DPYLSFAAAMNGLAGPLHGLANQEVLVWLTQLQKEVGKDVS
| | ADLIPKEQARIKTFRQQHGKTVVGQITVDMMYGGMRGMKGLVYETSVLDP
DEGIRFRGFSIPECQKLLPKAKGGEEPLPEGLFWLLVTGHIPTEEQVSWL
| |
| |
| |
| |
| |
| |
Matching transcripts |
CS-001 - ENSP00000342056 [100%]
CS-002 - ENSP00000446779 [100%]
CS-003 - ENSP00000440543 [100%]
| | CS-001 - ENSP00000342056 [100%]
CS-003 - ENSP00000440543 [100%]
CS-013 - ENSP00000448172 [100%]
CS-033 - ENSP00000447986 [96%]
| | | | | | | | | | | |
Other gene match |
| | | | | | | | | | | | | |
|
ANTIBODY VALIDATION
|
|
|
Immunohistochemistry
|
|
Image |
 | |  | |  | |  | |  | |  | |  | |
Description |
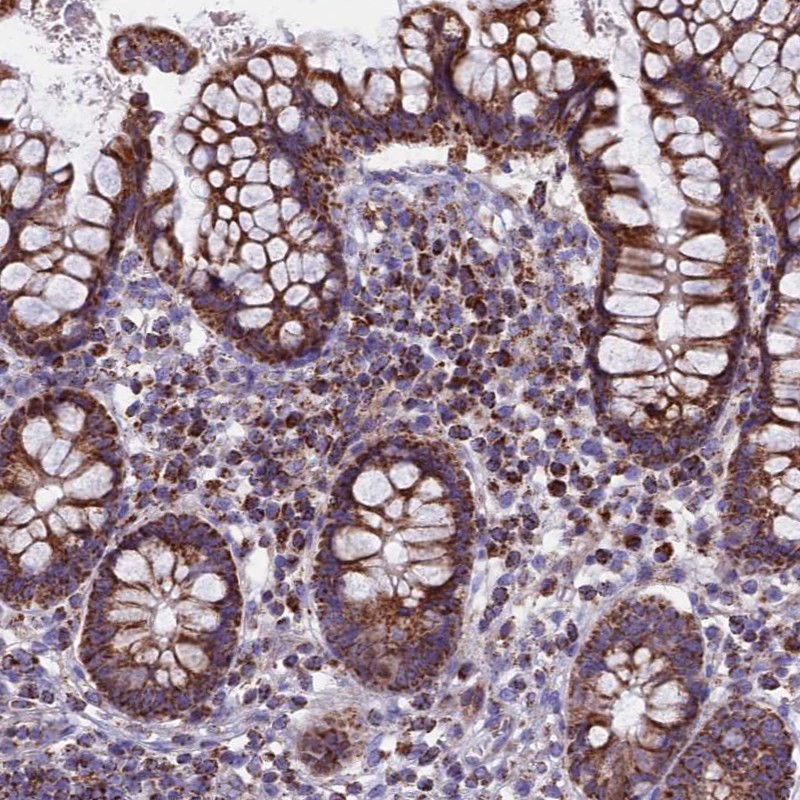
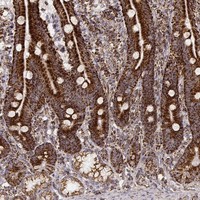
Immunohistochemical staining of human colon shows strong cytoplasmic positivity, seen with a granular pattern, in glandular cells.
More information | | Immunohistochemical staining of human heart muscle shows strong cytoplasmic positivity in myocytes.
More information | | Immunohistochemical staining of human duodenum shows cytoplasmic positivity in glandular cells.
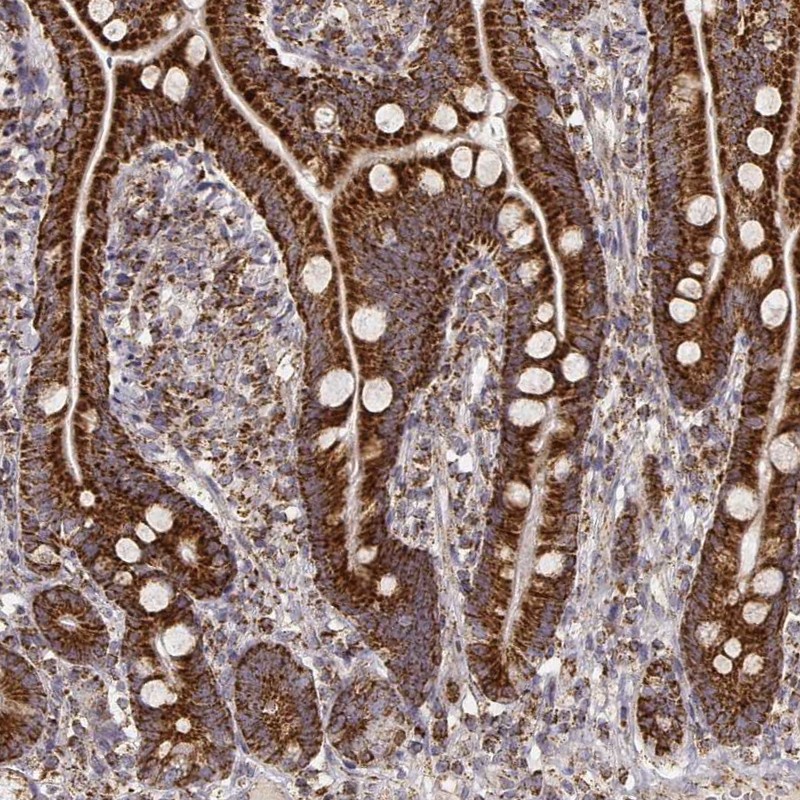
More information | | Immunohistochemical staining of human small intestine shows strong cytoplasmic positivity with a granular pattern in glandular cells.
More information | | Immunohistochemical staining of human duodenum shows cytoplasmic positivity in glandular cells.
More information | | Immunohistochemical staining of human duodenum shows cytoplasmic positivity in glandular cells.
More information | | Immunohistochemical staining of human small intestine shows strong cytoplasmic positivity with a granular pattern in glandular cells.
More information | |
Retrieval method |
HIER pH6 | | HIER pH6 | | HIER pH6 | | HIER pH6 | | HIER pH6 | | HIER pH6 | | HIER pH6 | |
Antibody dilution |
1:35 | | 1:500 | | 1:8000 | | 1:8000 | | 1:2500 | | 1:6000 | | 1:500 | |
Literature conformity |
Consistent with gene/protein characterization data | | Consistent with gene/protein characterization data | | Consistent with extensive gene/protein characterization data | | Consistent with extensive gene/protein characterization data | | Consistent with extensive gene/protein characterization data | | Consistent with extensive gene/protein characterization data | | Consistent with extensive gene/protein characterization data | |
RNA consistency |
Mainly consistent with RNA expression data | | Mainly consistent with RNA expression data | | Mainly consistent with RNA expression data | | Mainly consistent with RNA expression data | | Mainly consistent with RNA expression data | | Mainly consistent with RNA expression data | | Mainly consistent with RNA expression data | |
|
Immunofluorescence
|
|
Image |
 | |  | | | | | | | | | | | |
Description |
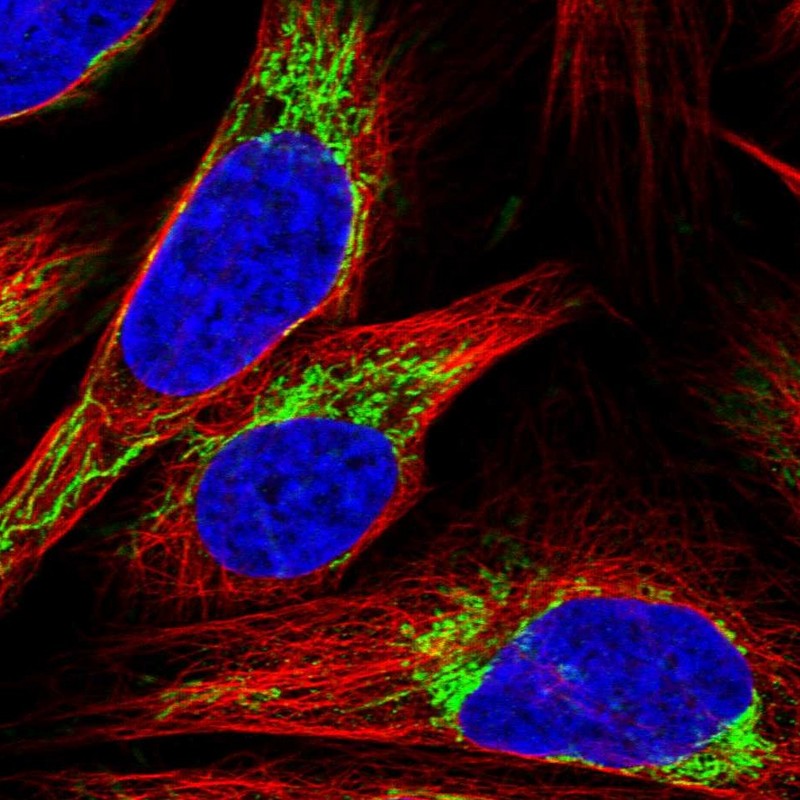
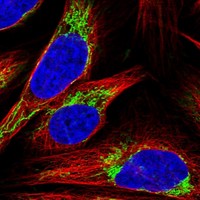
Immunofluorescent staining of human cell line U-2 OS shows positivity in mitochondria.
More information | | Immunofluorescent staining of human cell line U-2 OS shows positivity in mitochondria.
More information | | Application not done for this antibody. | | Application not done for this antibody. | | Application not done for this antibody. | | Application not done for this antibody. | | Application not done for this antibody. | |
Antibody dilution |
1:25 | | 1:62 | | | | | | | | | | | |
Validation IF |
Supportive: The subcellular location is supported by experimental gene/protein characterization data, gene silencing, or an independent antibody. | | Supportive: The subcellular location is supported by experimental gene/protein characterization data, gene silencing, or an independent antibody. | | | | | | | | | | | |
|
siRNA
|
|
Image |
 | | | | | | | | | | | | | |
Description |
Signal downregulation > 25% by one siRNA.
More information | | Application not done for this antibody. | | Application not done for this antibody. | | Application not done for this antibody. | | Application not done for this antibody. | | Application not done for this antibody. | | Application not done for this antibody. | |
Antibody dilution |
1:25 | | | | | | | | | | | | | |
Validation siRNA |
Supportive: The siRNA validation is supportive. | | | | | | | | | | | | | |
|
Western Blot
|
|
Image |
 | |  | |  | |  | |  | |  | |  | |
Description |
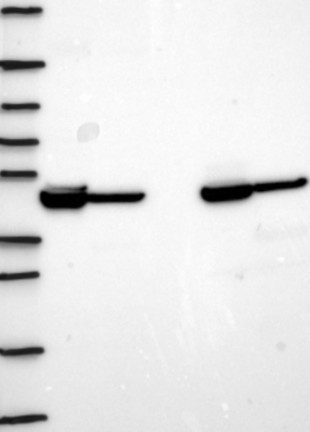
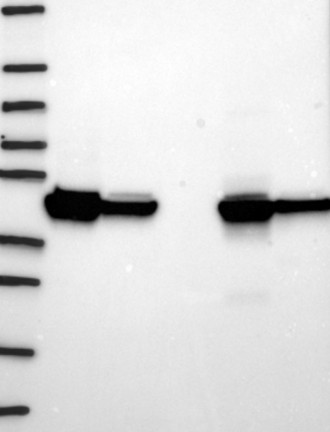
Lane 1: Marker [kDa] 250, 130, 95, 72, 55, 36, 28, 17, 10
Lane 2: RT4
Lane 3: U-251 MG
Lane 4: Human Plasma
Lane 5: Liver
Lane 6: Tonsil
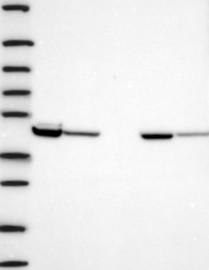
More information | | Lane 1: Marker [kDa] 250, 130, 95, 72, 55, 36, 28, 17, 10
Lane 2: RT4
Lane 3: U-251 MG
Lane 4: Human Plasma
Lane 5: Liver
Lane 6: Tonsil
More information | | Lane 1: Marker [kDa] 250, 130, 95, 72, 55, 36, 28, 17, 10
Lane 2: RT4
Lane 3: U-251 MG
Lane 4: Human Plasma
Lane 5: Liver
Lane 6: Tonsil
More information | | Lane 1: Marker [kDa] 250, 130, 95, 72, 55, 36, 28, 17, 10
Lane 2: RT4
Lane 3: U-251 MG
Lane 4: Human Plasma
Lane 5: Liver
Lane 6: Tonsil
More information | | Lane 1: Marker [kDa] 250, 130, 95, 72, 55, 36, 28, 17, 10
Lane 2: RT4
Lane 3: U-251 MG
Lane 4: Human Plasma
Lane 5: Liver
Lane 6: Tonsil
More information | | Lane 1: Marker [kDa] 250, 130, 95, 72, 55, 36, 28, 17, 10
Lane 2: RT4
Lane 3: U-251 MG
Lane 4: Human Plasma
Lane 5: Liver
Lane 6: Tonsil
More information | | Lane 1: Marker [kDa] 250, 130, 95, 72, 55, 36, 28, 17, 10
Lane 2: RT4
Lane 3: U-251 MG
Lane 4: Human Plasma
Lane 5: Liver
Lane 6: Tonsil
More information | |
Target mass (kDa) |
51.7, 50.4, 44.7 | | 51.7, 50.4, 19.4, 16.3 | | 51.7, 50.4, 44.7, 19.4, 17, 16.3, 16.1, 16, 15.8, 15.6, 15.5, 14.1, 13.3, 13.1, 12.6, 9.1, 7.4 | | 51.7, 50.4, 44.7, 19.4, 17, 16.3, 16.1, 16, 15.8, 15.6, 15.5, 14.1, 13.3, 13.1, 12.6, 9.1, 7.4 | | 51.7, 50.4, 44.7, 19.4, 17, 16.3, 16.1, 16, 15.8, 15.6, 15.5, 14.1, 13.3, 13.1, 12.6, 9.1, 7.4 | | 51.7, 50.4, 44.7, 19.4, 17, 16.3, 16.1, 16, 15.8, 15.6, 15.5, 14.1, 13.3, 13.1, 12.6, 9.1, 7.4 | | 51.7, 50.4, 44.7, 19.4, 17, 16.3, 16.1, 16, 15.8, 15.6, 15.5, 14.1, 13.3, 13.1, 12.6, 9.1, 7.4 | |
Antibody dilution |
1:250 | | 1:250 | | 1:500 | | 1:500 | | 1:500 | | 1:500 | | 1:500 | |
Validation WB |
Supportive: Band of predicted size in kDa (+/-20%) with additional bands present | | Supportive: Single band corresponding to the predicted size in kDa (+/-20%) | | Supportive: Single band corresponding to the predicted size in kDa (+/-20%) | | Supportive: Single band corresponding to the predicted size in kDa (+/-20%) | | Supportive: Single band corresponding to the predicted size in kDa (+/-20%) | | Supportive: Single band corresponding to the predicted size in kDa (+/-20%) | | Supportive: Single band corresponding to the predicted size in kDa (+/-20%) | |
|
Protein array
|
|
Image |
 | |  | | | | | | | | | | | |
Description |
Antibody specificity analysis with protein arrays. Predicted and matching interactions are shown in green.
More information | | Antibody specificity analysis with protein arrays. Predicted and matching interactions are shown in green.
More information | | Application not done for this antibody. | | Application not done for this antibody. | | Application not done for this antibody. | | Application not done for this antibody. | | Application not done for this antibody. | |
Antibody dilution |
1:3000 | | 1:3000 | | | | | | | | | | | |
Validation PA |
Supportive: Pass with single peak corresponding to interaction only with its own antigen. | | Supportive: Pass with single peak corresponding to interaction only with its own antigen. | | | | | | | | | | | |
| |