|
Antibody HPA030212
|
|
Antibody HPA030213
|
|
Antibody HPA030214
|
|
Antibody HPA030215
|
|
Antibody HPA049868
|
|
Antibody CAB013496
|
|
|
ANTIBODY INFORMATION
|
|
Provider |
Atlas Antibodies
Sigma-Aldrich
| | Atlas Antibodies
Sigma-Aldrich
| | Atlas Antibodies
Sigma-Aldrich
| | Atlas Antibodies
Sigma-Aldrich
| | Atlas Antibodies
Sigma-Aldrich
| | Zymed
| |
Product name |
HPA030212 | | HPA030213 | | HPA030214 | | HPA030215 | | HPA049868 | | 36-4300 | |
Host species |
Rabbit | | Rabbit | | Rabbit | | Rabbit | | Rabbit | | Rabbit | |
Clonality |
pAb | | pAb | | pAb | | pAb | | pAb | | pAb | |
Purity |
Affinity purified using the PrEST-antigen as affinity ligand | | Affinity purified using the PrEST-antigen as affinity ligand | | Affinity purified using the PrEST-antigen as affinity ligand | | Affinity purified using the PrEST-antigen as affinity ligand | | Affinity purified using the PrEST-antigen as affinity ligand | | Not known | |
Released in version |
6 | | 6 | | 6 | | 6 | | 14 | | 4 | |
|
ANTIGEN INFORMATION
|
|
Antigen |
Recombinant protein fragment | | Recombinant protein fragment | | Recombinant protein fragment | | Recombinant protein fragment | | Recombinant protein fragment | | Not known | |
Length (aa) |
101 | | 103 | | 81 | | 86 | | 63 | | | |
Antigen sequence |
ASHVFKFVDPSQDHALAKRSVDGGLMVKGPRHKPGIVQETTFDLGGDIHS
GTALPTSKSTTRLDSDRVSSASSTAERGMVKPMIRVEQQPDYRRQESRTQ
D
| | KPEKPSTLQRPQETVIRELQPQQQPRTIERRDLQYITVSKEELSSGDSLS
PDPWKRDAKEKLEKQQQMHIVDMLSKEIQELQSKPDRSAEESDRLRKLML
EWQ
| | DSGGTLRIYADSLKPNIPYKTILLSTTDPADFAVAEALEKYGLEKENPKD
YCIARVMLPPGAQHSDEKGAKEIILDDDECP
| | EAWAEKQGLELAADCHLSRIVQATTLLTMDKYAPDDIPNINSTCFKLNSL
QLQALLQNYHCAPDEPFIPTDLIENVVTVAENTADE
| | DDRPFQGEDVENSRLAAEVYKDMPETSFTRTISNPEVVMKRRRQQKLEKR
MQEFRSSDGRPDS
| |
| |
Matching transcripts |
MLLT4-002 - ENSP00000341118 [100%]
MLLT4-003 - ENSP00000383623 [100%]
MLLT4-004 - ENSP00000252692 [100%]
MLLT4-005 - ENSP00000414675 [100%]
MLLT4-013 - ENSP00000404595 [100%]
MLLT4-014 - ENSP00000375956 [100%]
MLLT4-201 - ENSP00000355771 [100%]
MLLT4-202 - ENSP00000375960 [100%]
| | MLLT4-002 - ENSP00000341118 [100%]
MLLT4-003 - ENSP00000383623 [100%]
MLLT4-004 - ENSP00000252692 [100%]
MLLT4-013 - ENSP00000404595 [100%]
MLLT4-014 - ENSP00000375956 [100%]
MLLT4-201 - ENSP00000355771 [100%]
MLLT4-202 - ENSP00000375960 [100%]
| | MLLT4-002 - ENSP00000341118 [100%]
MLLT4-003 - ENSP00000383623 [100%]
MLLT4-004 - ENSP00000252692 [100%]
MLLT4-013 - ENSP00000404595 [100%]
MLLT4-014 - ENSP00000375956 [100%]
MLLT4-201 - ENSP00000355771 [100%]
MLLT4-202 - ENSP00000375960 [100%]
| | MLLT4-002 - ENSP00000341118 [100%]
MLLT4-003 - ENSP00000383623 [100%]
MLLT4-004 - ENSP00000252692 [100%]
MLLT4-013 - ENSP00000404595 [100%]
MLLT4-014 - ENSP00000375956 [100%]
MLLT4-201 - ENSP00000355771 [100%]
MLLT4-202 - ENSP00000375960 [100%]
MLLT4-009 - ENSP00000426462 [87%]
| | MLLT4-002 - ENSP00000341118 [100%]
MLLT4-003 - ENSP00000383623 [100%]
MLLT4-004 - ENSP00000252692 [100%]
MLLT4-010 - ENSP00000383626 [100%]
MLLT4-011 - ENSP00000383625 [100%]
MLLT4-013 - ENSP00000404595 [100%]
MLLT4-014 - ENSP00000375956 [100%]
MLLT4-201 - ENSP00000355771 [100%]
MLLT4-202 - ENSP00000375960 [100%]
| | | |
Other gene match |
| | | | | | | | | | | |
|
ANTIBODY VALIDATION
|
|
|
Immunohistochemistry
|
|
Image |
 | |  | |  | |  | | | |  | |
Description |
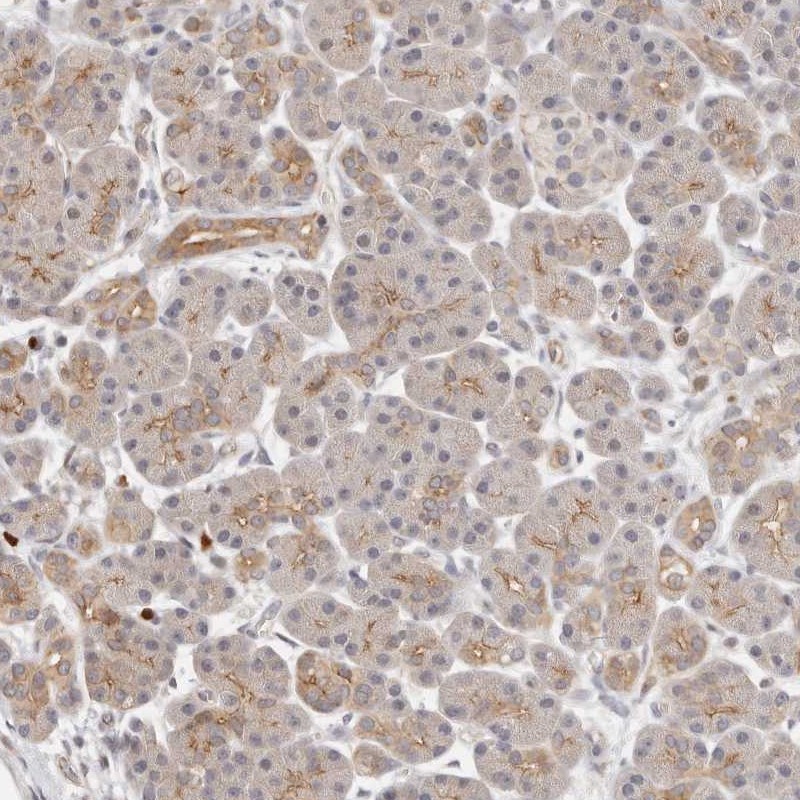
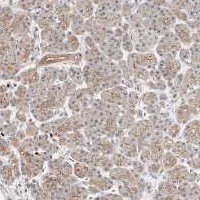
Immunohistochemical staining of human pancreas shows distinct positivity in acinar luminal membranes.
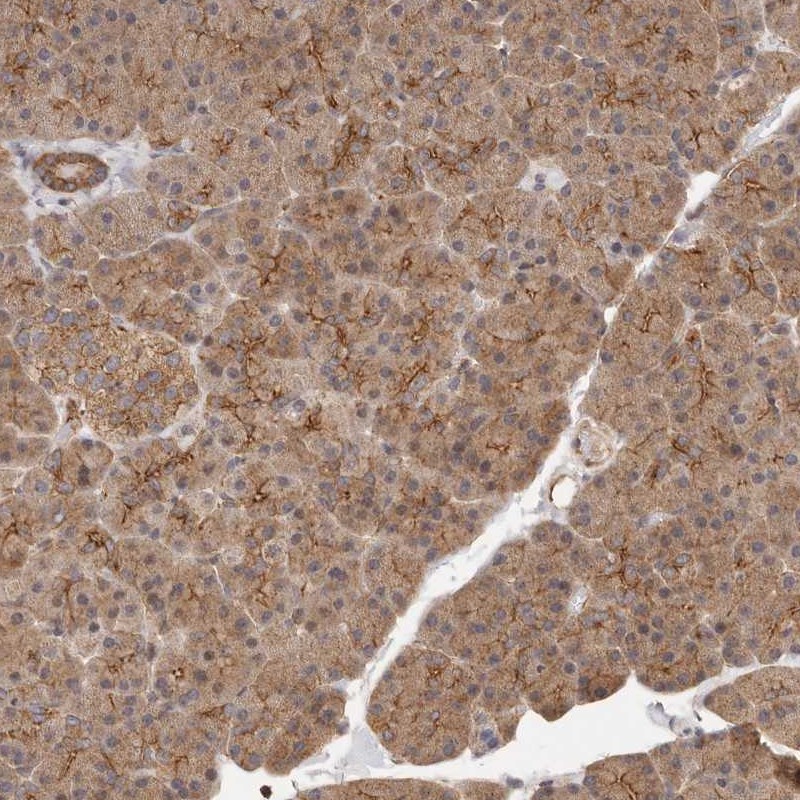
More information | | Immunohistochemical staining of human pancreas shows moderate cytoplasmic and strong luminal membranous positivity in exocrine cells.
More information | | Immunohistochemical staining of human testis shows strong cytoplasmic positivity in cells in seminiferus ducts.
More information | | Immunohistochemical staining of human pancreas shows moderate granular positivity in exocrine cells.
More information | | Application not done for this antibody. | | Immunohistochemical staining of human pancreas shows distinct positivity in intercalated ducts.
More information | |
Retrieval method |
HIER pH6 | | HIER pH6 | | HIER pH6 | | HIER pH6 | | | | HIER pH6 | |
Antibody dilution |
1:400 | | 1:400 | | 1:400 | | 1:250 | | | | 1:175 | |
Literature conformity |
Partly consistent with extensive gene/protein characterization data | | Partly consistent with extensive gene/protein characterization data | | Partly consistent with extensive gene/protein characterization data | | Partly consistent with extensive gene/protein characterization data | | | | Partly consistent with extensive gene/protein characterization data | |
RNA consistency |
Not done | | Not done | | Not done | | Not done | | | | Not done | |
|
Immunofluorescence
|
|
Image |
 | |  | | | |  | |  | |  | |
Description |
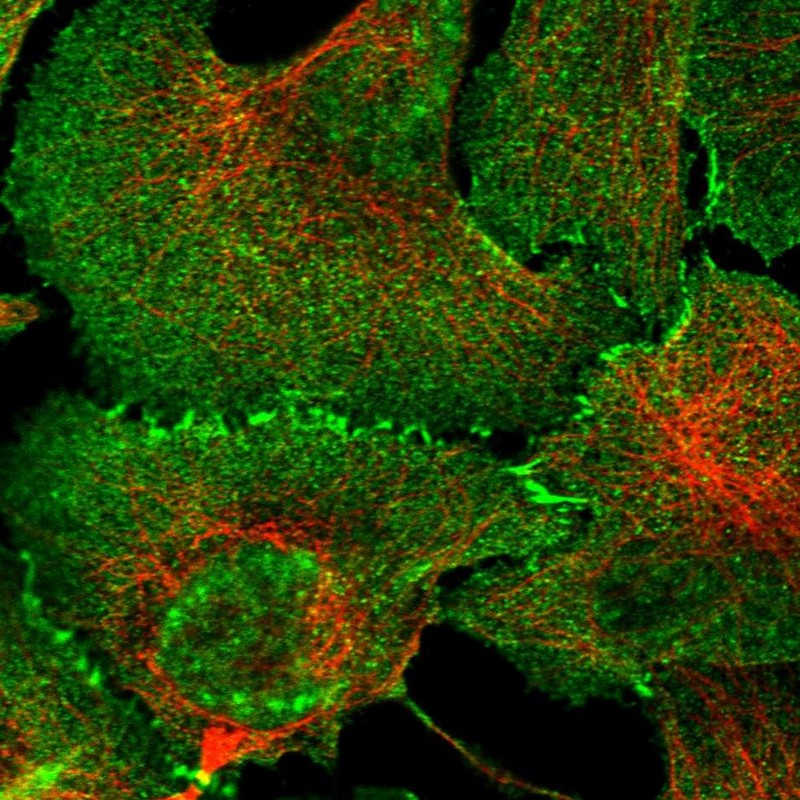
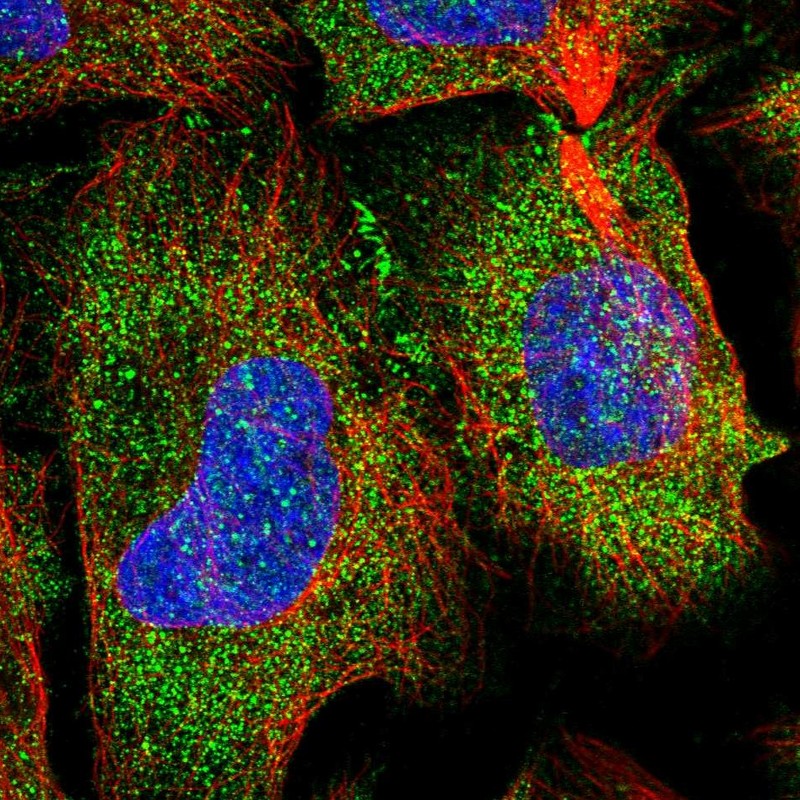
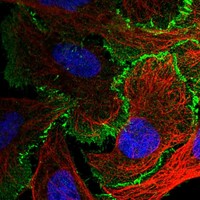
Immunofluorescent staining of human cell line A-431 shows positivity in plasma membrane, cell junctions & nucleus but excluded from the nucleoli.
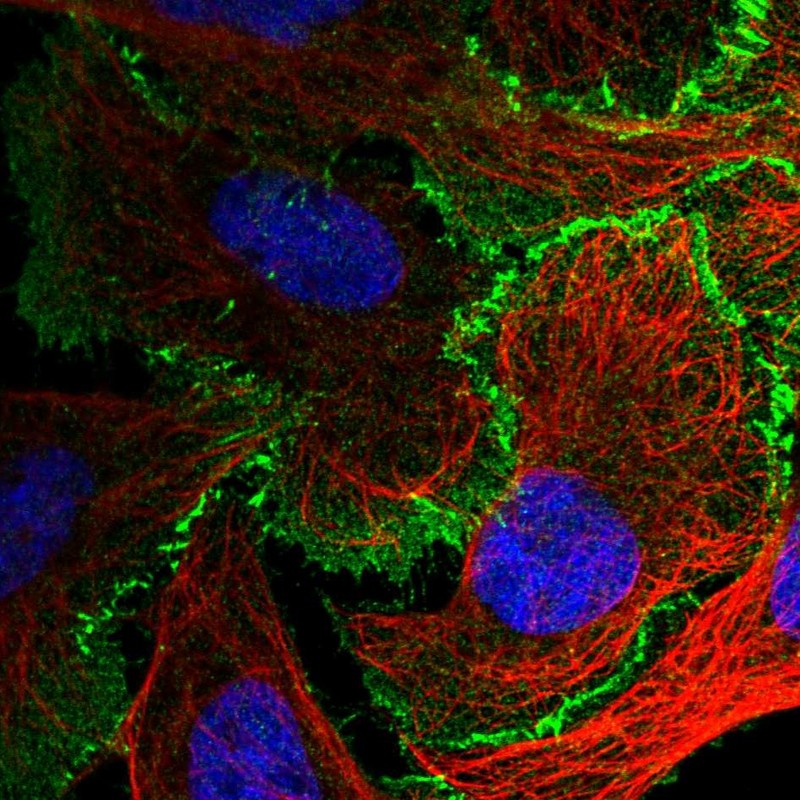
More information | | Immunofluorescent staining of human cell line U-2 OS shows positivity in plasma membrane, cell junctions & nucleus but excluded from the nucleoli.
More information | | Application not done for this antibody. | | Immunofluorescent staining of human cell line U-2 OS shows positivity in cytoplasm & cell junctions.
More information | | Immunofluorescent staining of human cell line U-2 OS shows positivity in plasma membrane & cell junctions.
More information | | Immunofluorescent staining of human cell line U-2 OS shows positivity in cytoplasm, cell junctions & nucleus but excluded from the nucleoli.
More information | |
Antibody dilution |
1:400 | | 1:200 | | | | 1:50 | | 1:83 | | 1:44 | |
Validation IF |
Supportive: The subcellular location is supported by experimental gene/protein characterization data, gene silencing, or an independent antibody. | | Supportive: The subcellular location is supported by experimental gene/protein characterization data, gene silencing, or an independent antibody. | | | | Supportive: The subcellular location is supported by experimental gene/protein characterization data, gene silencing, or an independent antibody. | | Supportive: The subcellular location is supported by experimental gene/protein characterization data, gene silencing, or an independent antibody. | | Supportive: The subcellular location is supported by experimental gene/protein characterization data, gene silencing, or an independent antibody. | |
|
Western Blot
|
|
Image |
 | | | | | | | | | | | |
Description |
Lane 1: Marker [kDa] 230, 130, 95, 72, 56, 36, 28, 17, 11
Lane 2: RT4
Lane 3: U-251 MG
Lane 4: Human Plasma
Lane 5: Liver
Lane 6: Tonsil
More information | | | | | | | | | | | |
Target mass (kDa) |
207.8, 207.6, 206.8, 201.8, 197.7, 189.2, 187.7, 43.2 | | 207.8, 207.6, 206.8, 201.8, 197.7, 189.2, 187.7 | | 207.8, 207.6, 206.8, 201.8, 197.7, 189.2, 187.7 | | 207.8, 207.6, 206.8, 201.8, 197.7, 189.2, 187.7, 18.8 | | 207.8, 207.6, 206.8, 201.8, 197.7, 189.2, 187.7, 29.1, 28.9 | | 207.8, 207.6, 206.8, 201.8, 197.7, 189.2, 187.7, 43.2, 36.4, 29.1, 28.9, 20.6, 18.8, 16, 13.1 | |
Antibody dilution |
1:250 | | 1:250 | | 1:250 | | 1:250 | | 1:100 | | 1:500 | |
Validation WB |
Supportive: Band of predicted size in kDa (+/-20%) with additional bands present | | Non-supportive: Weak band of predicted size but with additional bands of higher intensity also present | | Non-supportive: Only bands not corresponding to the predicted size | | Non-supportive: Only bands not corresponding to the predicted size | | Non-supportive: Weak band of predicted size but with additional bands of higher intensity also present | | Non-supportive: Only bands not corresponding to the predicted size | |
|
Protein array
|
|
Image |
 | |  | |  | |  | |  | | | |
Description |
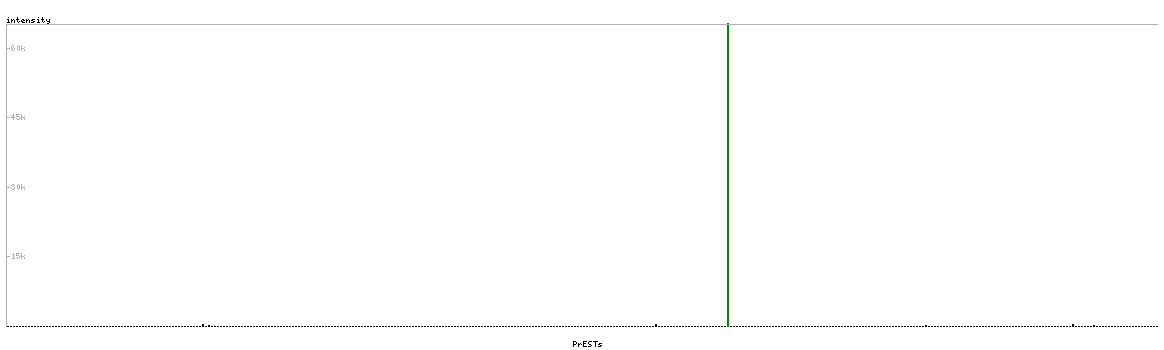
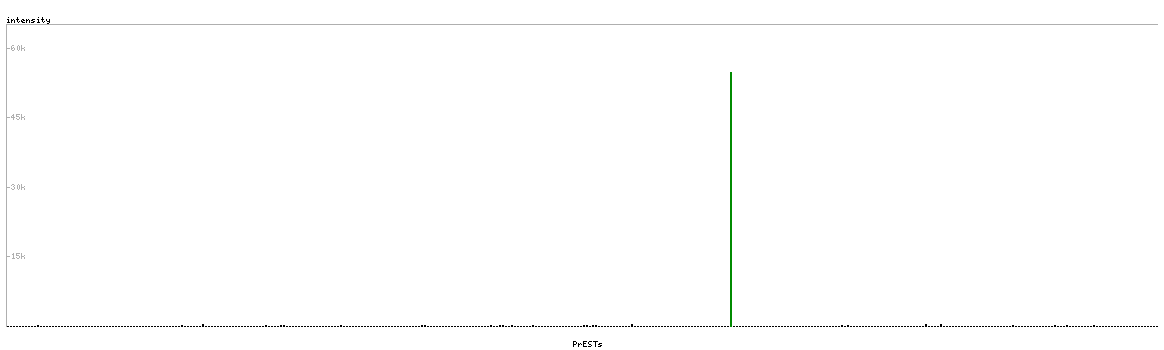
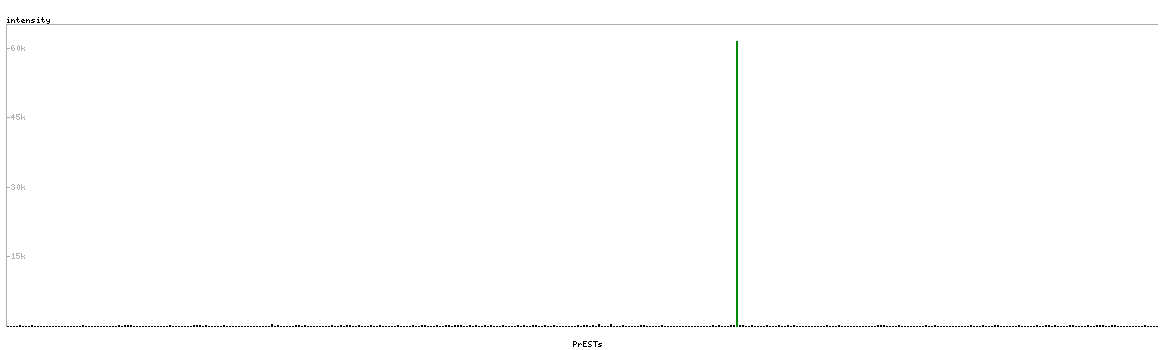
Antibody specificity analysis with protein arrays. Predicted and matching interactions are shown in green.
More information | | Antibody specificity analysis with protein arrays. Predicted and matching interactions are shown in green.
More information | | Antibody specificity analysis with protein arrays. Predicted and matching interactions are shown in green.
More information | | Antibody specificity analysis with protein arrays. Predicted and matching interactions are shown in green.
More information | | Antibody specificity analysis with protein arrays. Predicted and matching interactions are shown in green.
More information | | Application not done for this antibody. | |
Antibody dilution |
1:3000 | | 1:3000 | | 1:3000 | | 1:3000 | | 1:3350 | | | |
Validation PA |
Supportive: Pass with single peak corresponding to interaction only with its own antigen. | | Supportive: Pass with single peak corresponding to interaction only with its own antigen. | | Supportive: Pass with single peak corresponding to interaction only with its own antigen. | | Supportive: Pass with single peak corresponding to interaction only with its own antigen. | | Supportive: Pass with single peak corresponding to interaction only with its own antigen. | | | |
| |