|
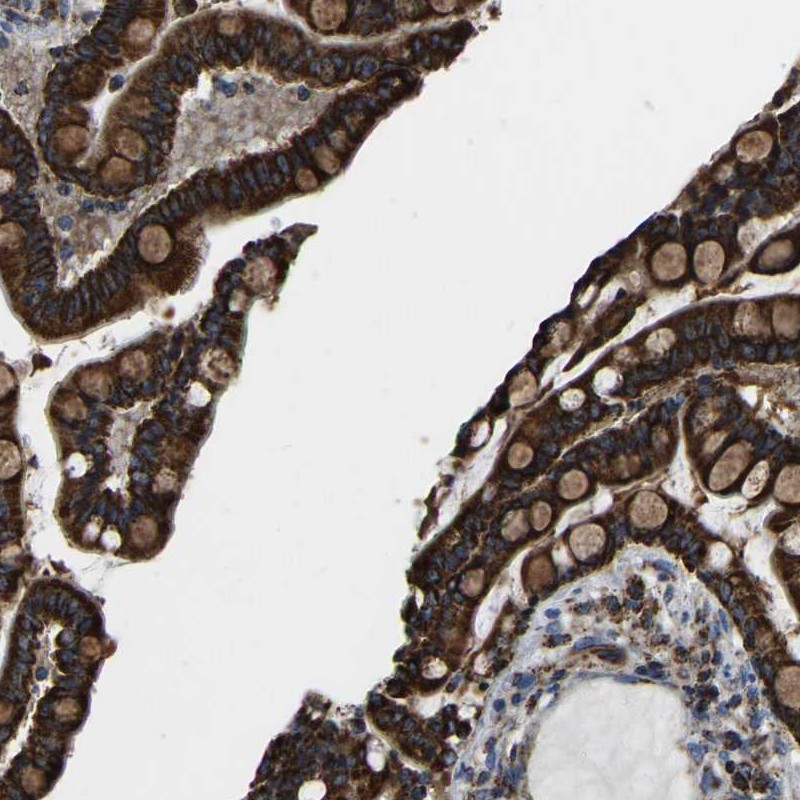
Antibody HPA018990
|
|
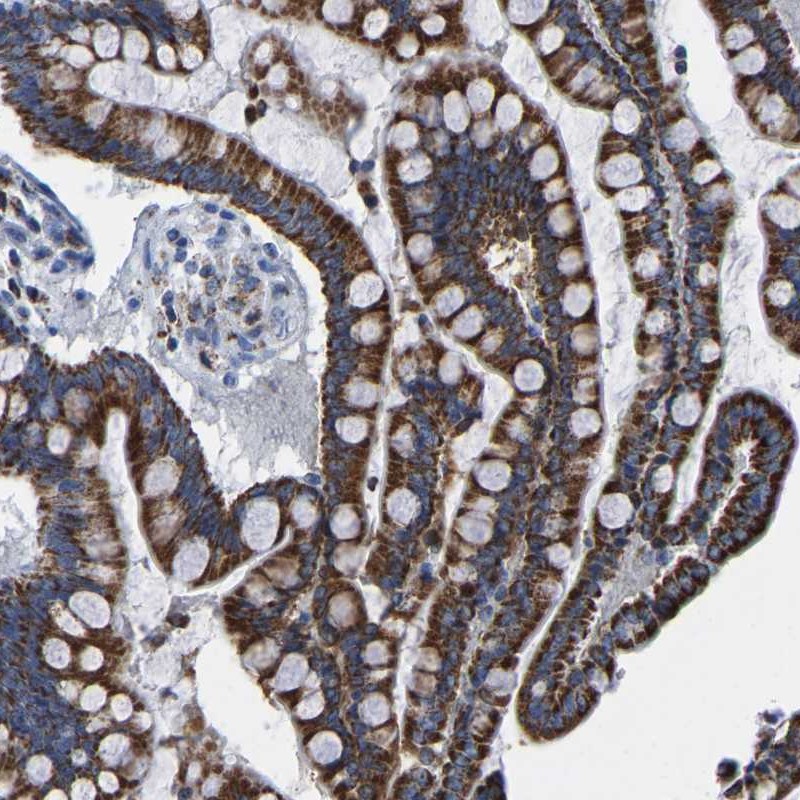
Antibody HPA018993
|
|
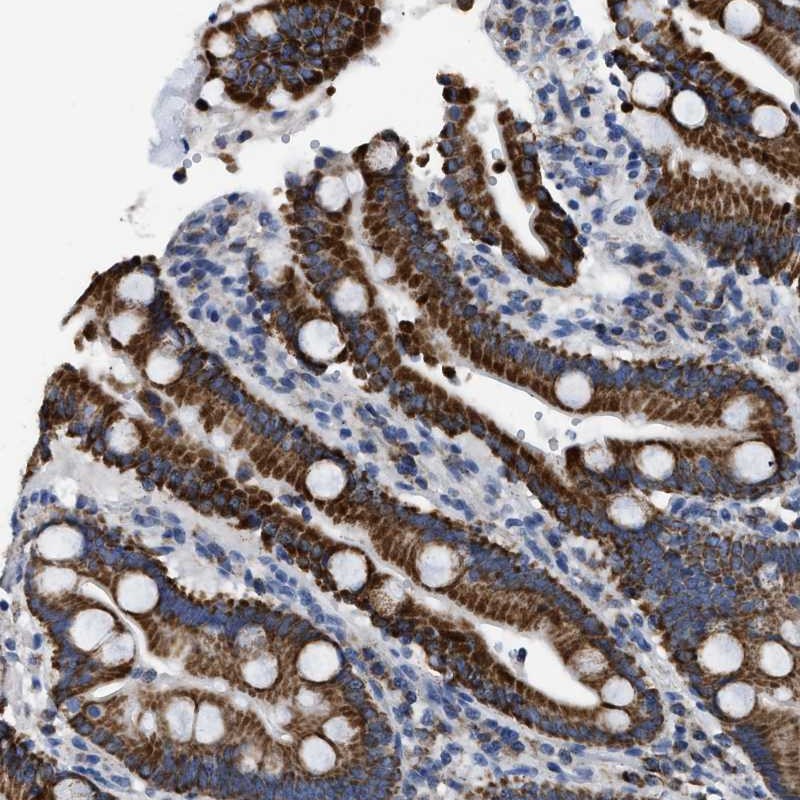
Antibody HPA018996
|
|
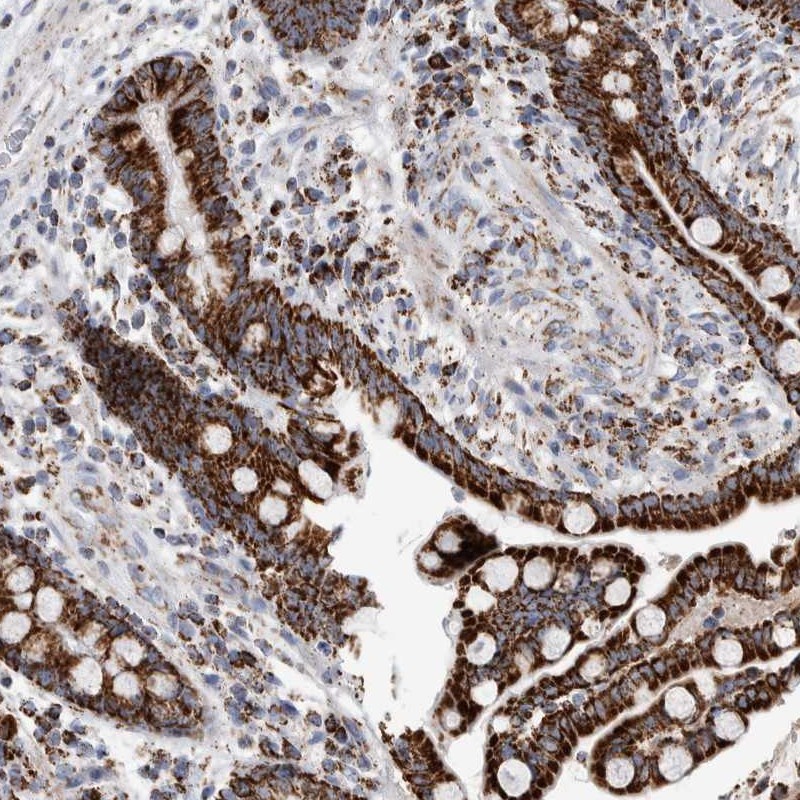
Antibody HPA024089
|
|
|
ANTIBODY INFORMATION
|
|
Provider |
Atlas Antibodies
Sigma-Aldrich
| | Atlas Antibodies
Sigma-Aldrich
| | Atlas Antibodies
Sigma-Aldrich
| | Atlas Antibodies
Sigma-Aldrich
| |
Product name |
HPA018990 | | HPA018993 | | HPA018996 | | HPA024089 | |
Host species |
Rabbit | | Rabbit | | Rabbit | | Rabbit | |
Clonality |
pAb | | pAb | | pAb | | pAb | |
Purity |
Affinity purified using the PrEST-antigen as affinity ligand | | Affinity purified using the PrEST-antigen as affinity ligand | | Affinity purified using the PrEST-antigen as affinity ligand | | Affinity purified using the PrEST-antigen as affinity ligand | |
Released in version |
4 | | 4 | | 4 | | 5 | |
|
ANTIGEN INFORMATION
|
|
Antigen |
Recombinant protein fragment | | Recombinant protein fragment | | Recombinant protein fragment | | Recombinant protein fragment | |
Length (aa) |
80 | | 87 | | 91 | | 72 | |
Antigen sequence |
VDAGFVPNDMQVGQTGKIVAPELYIAVGISGAIQHLAGMKDSKTIVAINK
DPEAPIFQVADYGIVADLFKVVPEMTEILK
| | MFRAAAPGQLRRAASLLRFQSTLVIAEHANDSLAPITLNTITAATRLGGE
VSCLVAGTKCDKVAQDLCKVAGIAKVLVAQHDVYKGL
| | LPEELTPLILATQKQFNYTHICAGASAFGKNLLPRVAAKLEVAPISDIIA
IKSPDTFVRTIYAGNALCTVKCDEKVKVFSVRGTSFDAAAT
| | GGSASSEKASSTSPVEISEWLDQKLTKSDRPELTGAKVVVSGGRGLKSGE
NFKLLYDLADQLHAAVGASRAA
| |
Matching transcripts |
ETFA-001 - ENSP00000452762 [100%]
ETFA-002 - ENSP00000399273 [100%]
ETFA-014 - ENSP00000452659 [100%]
ETFA-019 - ENSP00000453345 [94%]
ETFA-017 - ENSP00000454194 [91%]
ETFA-006 - ENSP00000453098 [89%]
| | ETFA-001 - ENSP00000452762 [100%]
ETFA-011 - ENSP00000452777 [100%]
ETFA-019 - ENSP00000453345 [100%]
| | ETFA-001 - ENSP00000452762 [100%]
ETFA-002 - ENSP00000399273 [100%]
ETFA-011 - ENSP00000452777 [100%]
ETFA-012 - ENSP00000453017 [100%]
ETFA-019 - ENSP00000453345 [100%]
ETFA-017 - ENSP00000454194 [89%]
| | ETFA-001 - ENSP00000452762 [100%]
ETFA-002 - ENSP00000399273 [100%]
ETFA-014 - ENSP00000452659 [100%]
ETFA-017 - ENSP00000454194 [100%]
| |
Other gene match |
| | | | | | | |
|
ANTIBODY VALIDATION
|
|
|
Immunohistochemistry
|
|
Image |
 | |  | |  | |  | |
Description |
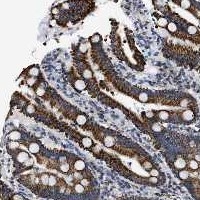
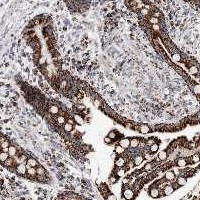
Immunohistochemical staining of human colon shows strong cytoplasmic positivity with a granular pattern, in glandular cells.
More information | | Immunohistochemical staining of human colon shows strong cytoplasmic positivity in granular pattern in glandular cells.
More information | | Immunohistochemical staining of human duodenum shows strong cytoplasmic positivity in granular pattern in glandular cells.
More information | | Immunohistochemical staining of human colon shows strong cytoplasmic positivity with a granular pattern in glandular cells.
More information | |
Retrieval method |
HIER pH6 | | HIER pH6 | | HIER pH6 | | HIER pH6 | |
Antibody dilution |
1:150 | | 1:125 | | 1:15 | | 1:800 | |
Literature conformity |
Consistent with extensive gene/protein characterization data | | Consistent with extensive gene/protein characterization data | | Consistent with extensive gene/protein characterization data | | Consistent with extensive gene/protein characterization data | |
RNA consistency |
Not done | | Not done | | Not done | | Not done | |
|
Immunofluorescence
|
|
Image |
 | |  | | | |  | |
Description |
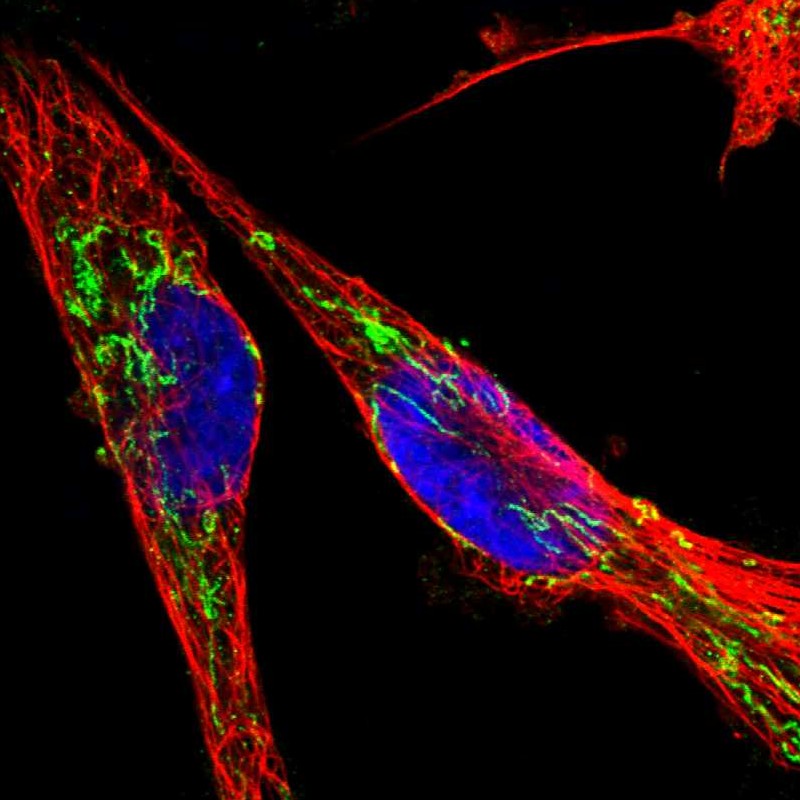
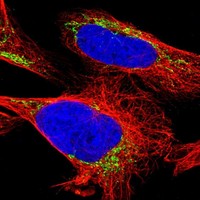
Immunofluorescent staining of human cell line U-251 MG shows positivity in mitochondria.
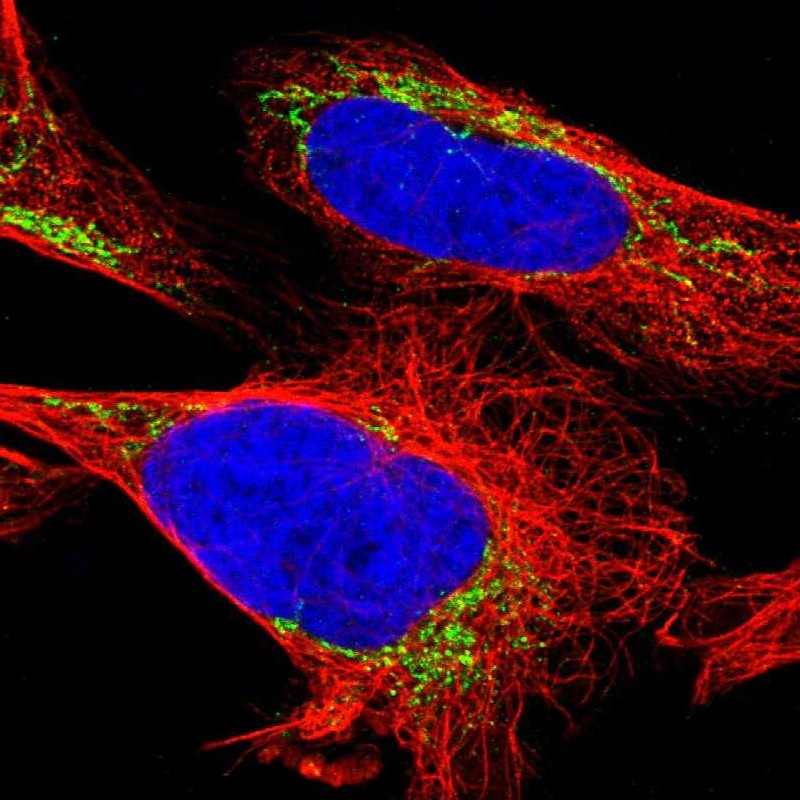
More information | | Immunofluorescent staining of human cell line U-2 OS shows positivity in mitochondria.
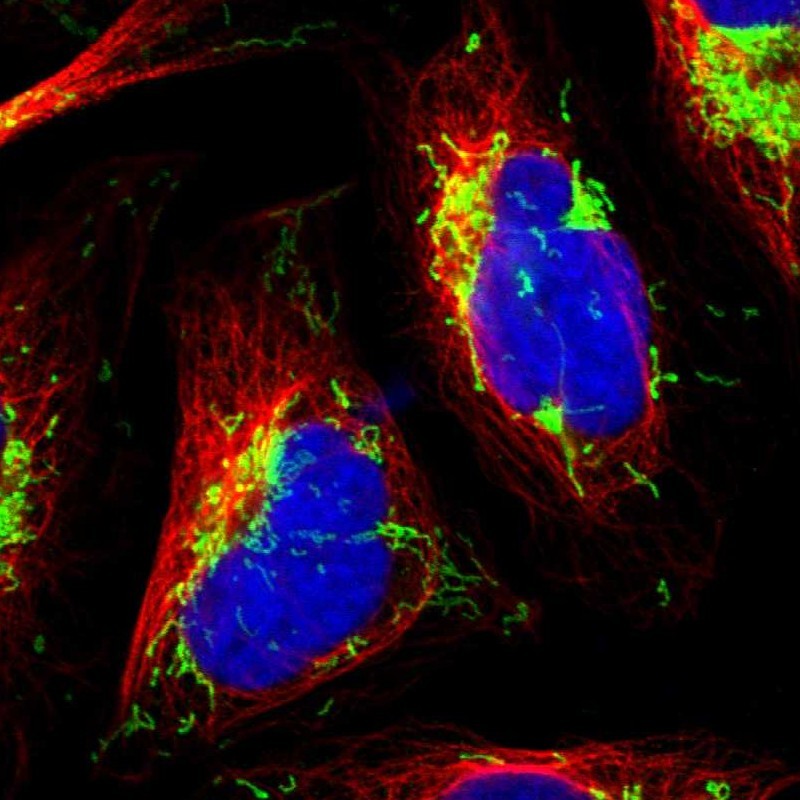
More information | | Application not done for this antibody. | | Immunofluorescent staining of human cell line U-2 OS shows positivity in mitochondria.
More information | |
Antibody dilution |
1:25 | | 1:49 | | | | 1:100 | |
Validation IF |
Supportive: The subcellular location is supported by experimental gene/protein characterization data, gene silencing, or an independent antibody. | | Supportive: The subcellular location is supported by experimental gene/protein characterization data, gene silencing, or an independent antibody. | | | | Supportive: The subcellular location is supported by experimental gene/protein characterization data, gene silencing, or an independent antibody. | |
|
siRNA
|
|
Image |
| | | | | |  | |
Description |
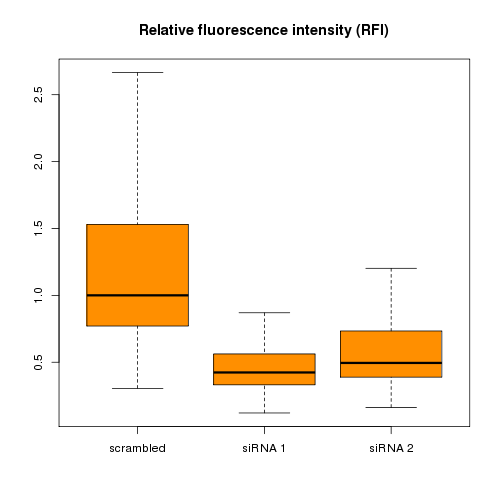
Application not done for this antibody. | | Application not done for this antibody. | | Application not done for this antibody. | | Signal downregulation > 25% by both siRNA:s.
More information | |
Antibody dilution |
| | | | | | 1:118 | |
Validation siRNA |
| | | | | | Supportive: The siRNA validation is supportive. | |
|
Western blot - siRNA
|
|
Image |
| | | | | |  | |
Description |
Application not done for this antibody. | | Application not done for this antibody. | | Application not done for this antibody. | | Lane 1: Marker [kDa] 250, 130, 95, 72, 55, 36, 28, 17, 10
Lane 2: siRNA 1
Lane 3: siRNA 2
Lane 4: Scrambled
More information | |
Target mass (kDa) |
| | | | | | 35.1, 30, 26.8, 24.2 | |
Loading control |
| | | | | | Total protein image | |
Antibody dilution |
| | | | | | 1:261 | |
Validation WB-siRNA |
| | | | | | Supportive: Downregulation visible in both siRNA lanes | |
|
Western Blot
|
|
Image |
 | |  | |  | |  | |
Description |
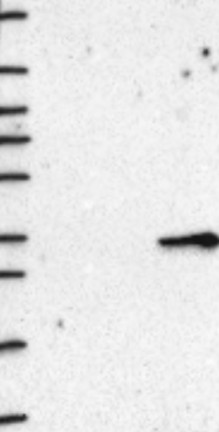
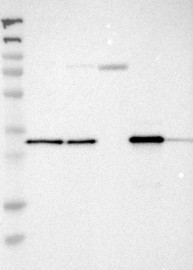
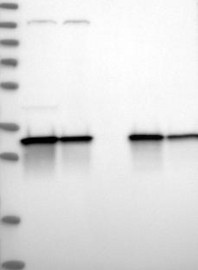
Lane 1: Marker [kDa] 230, 130, 95, 72, 56, 36, 28, 17, 11
Lane 2: RT4
Lane 3: U-251 MG
Lane 4: Human Plasma
Lane 5: Liver
Lane 6: Tonsil
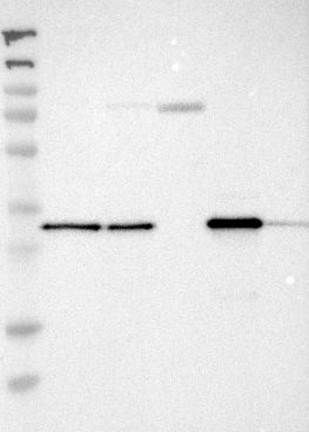
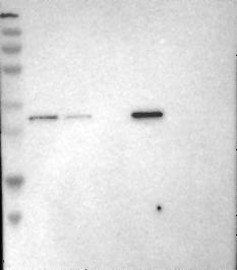
More information | | Lane 1: Marker [kDa] 230, 130, 95, 72, 56, 36, 28, 17, 11
Lane 2: RT4
Lane 3: U-251 MG
Lane 4: Human Plasma
Lane 5: Liver
Lane 6: Tonsil
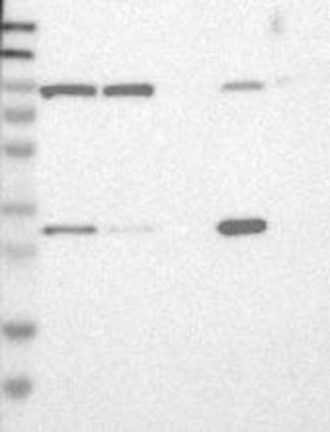
More information | | Lane 1: Marker [kDa] 230, 130, 95, 72, 56, 36, 28, 17, 11
Lane 2: RT4
Lane 3: U-251 MG
Lane 4: Human Plasma
Lane 5: Liver
Lane 6: Tonsil
More information | | Lane 1: Marker [kDa] 230, 130, 95, 72, 56, 36, 28, 17, 11
Lane 2: RT4
Lane 3: U-251 MG
Lane 4: Human Plasma
Lane 5: Liver
Lane 6: Tonsil
More information | |
Target mass (kDa) |
35.1, 31.7, 30, 26.8, 24.2, 7.8 | | 35.1, 31.7, 30.2 | | 35.1, 31.7, 30.2, 30, 26.8, 24.9 | | 35.1, 30, 26.8, 24.2 | |
Antibody dilution |
1:250 | | 1:250 | | 1:250 | | 1:250 | |
Validation WB |
Supportive: Band of predicted size in kDa (+/-20%) with additional bands present | | Supportive: Band of predicted size in kDa (+/-20%) with additional bands present | | Supportive: Single band corresponding to the predicted size in kDa (+/-20%) | | Supportive: Band of predicted size in kDa (+/-20%) with additional bands present | |
|
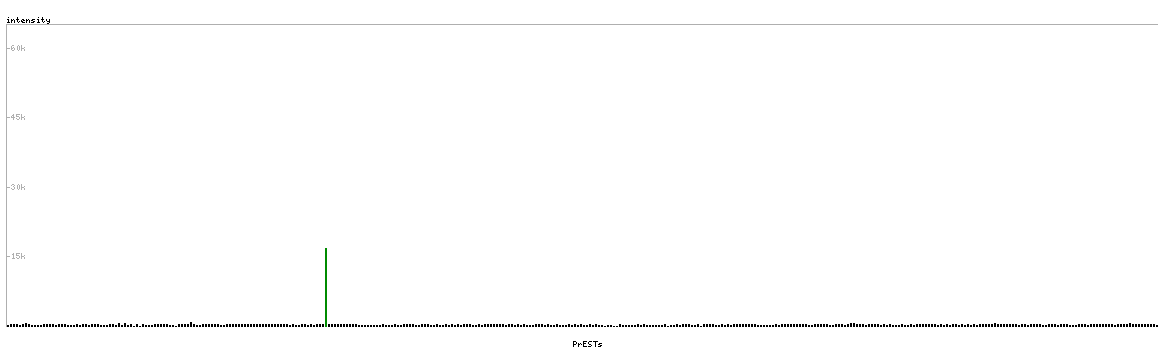
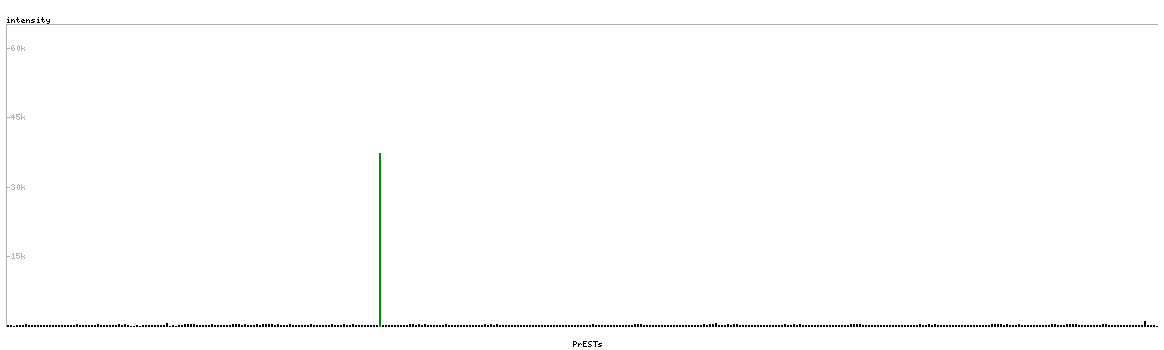
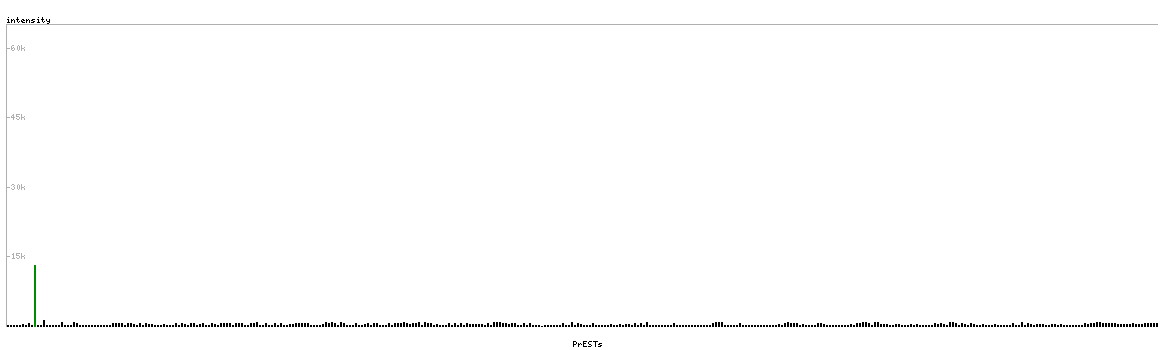
Protein array
|
|
Image |
 | |  | |  | |  | |
Description |
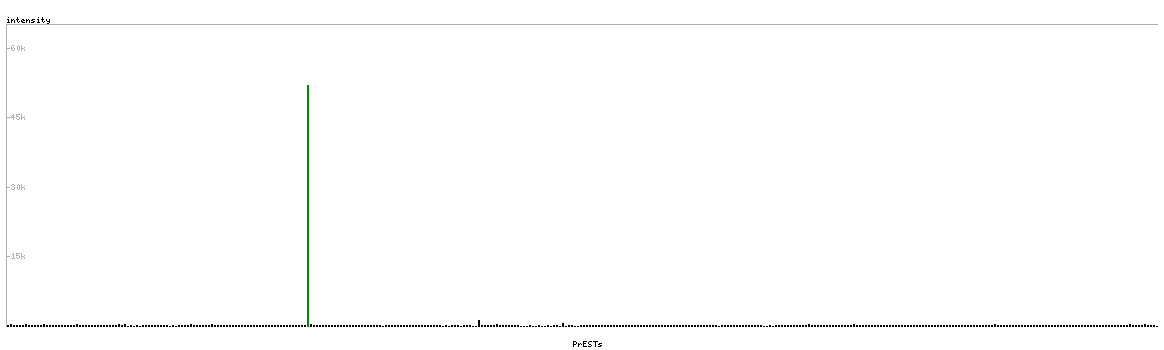
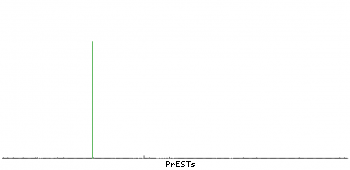
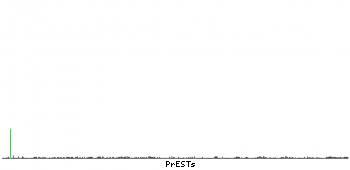
Antibody specificity analysis with protein arrays. Predicted and matching interactions are shown in green.
More information | | Antibody specificity analysis with protein arrays. Predicted and matching interactions are shown in green.
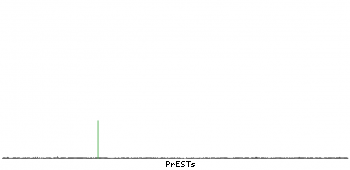
More information | | Antibody specificity analysis with protein arrays. Predicted and matching interactions are shown in green.
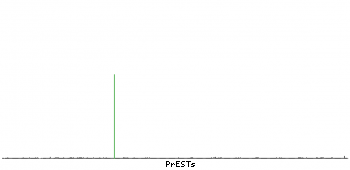
More information | | Antibody specificity analysis with protein arrays. Predicted and matching interactions are shown in green.
More information | |
Antibody dilution |
1:3000 | | 1:3000 | | 1:500 | | 1:3000 | |
Validation PA |
Supportive: Pass with single peak corresponding to interaction only with its own antigen. | | Supportive: Pass with single peak corresponding to interaction only with its own antigen. | | Supportive: Pass with single peak corresponding to interaction only with its own antigen. | | Supportive: Pass with single peak corresponding to interaction only with its own antigen. | |
| |