|
Antibody HPA023266
|
|
Antibody HPA023278
|
|
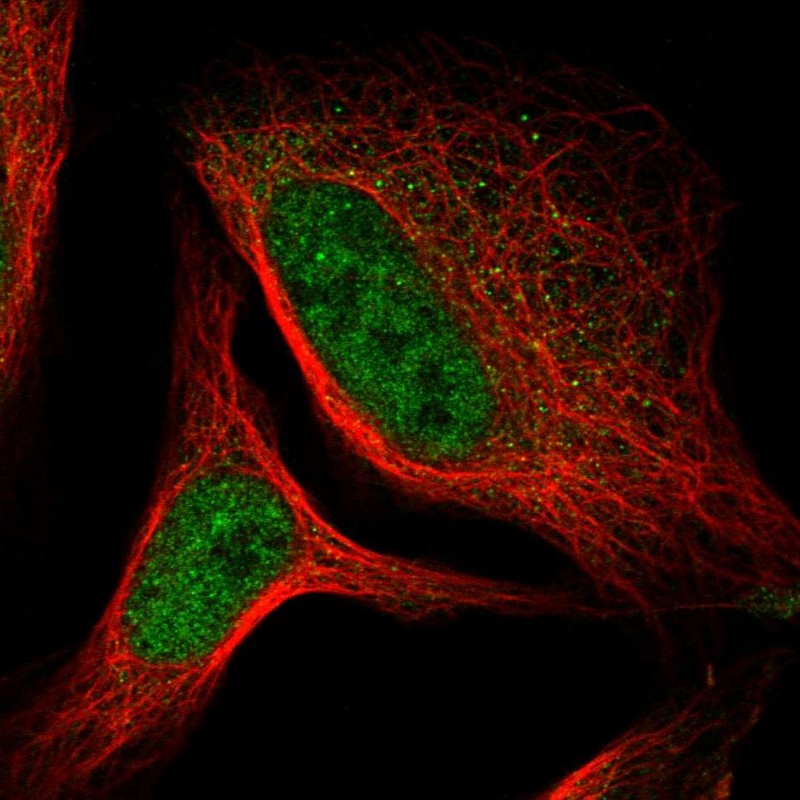
Antibody HPA023280
|
|
Antibody HPA023338
|
|
Antibody CAB002672
|
|
|
ANTIBODY INFORMATION
|
|
Provider |
Atlas Antibodies
Sigma-Aldrich
| | Atlas Antibodies
Sigma-Aldrich
| | Atlas Antibodies
Sigma-Aldrich
| | Atlas Antibodies
Sigma-Aldrich
| | Lab Vision/NeoMarkers
| |
Product name |
HPA023266 | | HPA023278 | | HPA023280 | | HPA023338 | | MS-349 | |
Host species |
Rabbit | | Rabbit | | Rabbit | | Rabbit | | Mouse | |
Clonality |
pAb | | pAb | | pAb | | pAb | | mAb | |
Purity |
Affinity purified using the PrEST-antigen as affinity ligand | | Affinity purified using the PrEST-antigen as affinity ligand | | Affinity purified using the PrEST-antigen as affinity ligand | | Affinity purified using the PrEST-antigen as affinity ligand | | Not known | |
Released in version |
5 | | 5 | | 5 | | 5 | | 1 | |
|
ANTIGEN INFORMATION
|
|
Antigen |
Recombinant protein fragment | | Recombinant protein fragment | | Recombinant protein fragment | | Recombinant protein fragment | | Not known | |
Length (aa) |
73 | | 88 | | 87 | | 103 | | | |
Antigen sequence |
ADDLKKLKPGLEKDFLPLYFGWFLTKKSSETLRKAGQVFLEELGNHKAFK
KELRQFVPGDEPREKMDLVTYFG
| | GCAADVEAVQTGLDLLEILRQEKGGSRGEEVGELSRGKLYSLGNGRWMLT
LAKNMEVRAIFTGYYGKGKPVPTQGSRKGGALQSCTII
| | PGVLHCTTKFCDYGKAPGAEEYAQQDVLKKSYSKAFTLTISALFVTPKTT
GARVELSEQQLQLWPSDVDKLSPTDNLPRGSRAHITL
| | TLARVIVDKYRDGTKMVSADAYKITPGARGAFSEEYKRLDEDLAAYCRRR
DIRILVLDDTNHERERLEQLFEMADQYQYQVVLVEPKTAWRLDCAQLKEK
NQW
| |
| |
Matching transcripts |
CNP-001 - ENSP00000377470 [100%]
CNP-002 - ENSP00000377466 [100%]
| | CNP-001 - ENSP00000377470 [100%]
CNP-002 - ENSP00000377466 [100%]
| | CNP-001 - ENSP00000377470 [100%]
CNP-002 - ENSP00000377466 [100%]
| | CNP-001 - ENSP00000377470 [100%]
CNP-002 - ENSP00000377466 [100%]
CNP-010 - ENSP00000468198 [100%]
CNP-011 - ENSP00000468471 [100%]
CNP-004 - ENSP00000413104 [97%]
| | | |
Other gene match |
| | | | | | | | | |
|
ANTIBODY VALIDATION
|
|
|
Immunohistochemistry
|
|
Image |
 | |  | |  | |  | |  | |
Description |
Immunohistochemical staining of human cerebral cortex shows strong cytoplasmic positivity in glial cells.
More information | | Immunohistochemical staining of human cerebral cortex shows strong cytoplasmic positivity in a subset of glial cells.
More information | | Immunohistochemical staining of human cerebral cortex shows strong cytoplasmic positivity in glial cells.
More information | | Immunohistochemical staining of human hippocampus shows strong cytoplasmic positivity in a subset of glial cells.
More information | | Immunohistochemical staining of human cerebellum shows strong cytoplasmic positivity in cells in granular layer and neuropil.
More information | |
Retrieval method |
HIER pH6 | | HIER pH6 | | HIER pH6 | | HIER pH6 | | HIER pH6 | |
Antibody dilution |
1:250 | | 1:1500 | | 1:2000 | | 1:1500 | | 1:100 | |
Literature conformity |
Consistent with extensive gene/protein characterization data | | Consistent with extensive gene/protein characterization data | | Consistent with extensive gene/protein characterization data | | Consistent with extensive gene/protein characterization data | | Consistent with extensive gene/protein characterization data | |
RNA consistency |
Mainly consistent with RNA expression data | | Mainly consistent with RNA expression data | | Mainly consistent with RNA expression data | | Mainly consistent with RNA expression data | | Mainly consistent with RNA expression data | |
|
Immunofluorescence
|
|
Image |
 | | | |  | | | | | |
Description |
Immunofluorescent staining of human cell line U-2 OS shows positivity in cytoplasm & nucleus but excluded from the nucleoli.
More information | | Application not done for this antibody. | | Immunofluorescent staining of human cell line U-251 MG shows positivity in cytoplasm & nucleus but excluded from the nucleoli.
More information | | Application not done for this antibody. | | Application not done for this antibody. | |
Antibody dilution |
1:7 | | | | 1:100 | | | | | |
Validation IF |
Supportive: The subcellular location is supported by experimental gene/protein characterization data, gene silencing, or an independent antibody. | | | | Supportive: The subcellular location is supported by experimental gene/protein characterization data, gene silencing, or an independent antibody. | | | | | |
|
Western Blot
|
|
Image |
 | |  | |  | |  | |  | |
Description |
Lane 1: Marker [kDa] 230, 130, 95, 72, 56, 36, 28, 17, 11
Lane 2: RT4
Lane 3: U-251 MG
Lane 4: Human Plasma
Lane 5: Liver
Lane 6: Tonsil
More information | | Lane 1: Marker [kDa] 230, 130, 95, 72, 56, 36, 28, 17, 11
Lane 2: RT4
Lane 3: U-251 MG
Lane 4: Human Plasma
Lane 5: Liver
Lane 6: Tonsil
More information | | Lane 1: Marker [kDa] 230, 130, 95, 72, 56, 36, 28, 17, 11
Lane 2: RT4
Lane 3: U-251 MG
Lane 4: Human Plasma
Lane 5: Liver
Lane 6: Tonsil
More information | | Lane 1: Marker [kDa] 230, 130, 95, 72, 56, 36, 28, 17, 11
Lane 2: RT4
Lane 3: U-251 MG
Lane 4: Human Plasma
Lane 5: Liver
Lane 6: Tonsil
More information | | Lane 1: Marker [kDa] 250, 130, 95, 72, 55, 36, 28, 17, 11
Lane 2: RT4
Lane 3: U-251 MG
Lane 4: Human Plasma
Lane 5: Liver
Lane 6: Tonsil
More information | |
Target mass (kDa) |
47.6, 45.1 | | 47.6, 45.1 | | 47.6, 45.1 | | 47.6, 45.1, 19.1, 17.7, 16.5 | | 47.6, 45.1, 19.1, 17.7, 16.5, 13.6, 5.4 | |
Antibody dilution |
1:250 | | 1:250 | | 1:250 | | 1:250 | | 1:500 | |
Validation WB |
Supportive: Band of predicted size in kDa (+/-20%) with additional bands present | | Supportive: Band of predicted size in kDa (+/-20%) with additional bands present | | Supportive: Band of predicted size in kDa (+/-20%) with additional bands present | | Supportive: Band of predicted size in kDa (+/-20%) with additional bands present | | Supportive: Single band corresponding to the predicted size in kDa (+/-20%) | |
|
Protein array
|
|
Image |
 | |  | |  | |  | | | |
Description |
Antibody specificity analysis with protein arrays. Predicted and matching interactions are shown in green.
More information | | Antibody specificity analysis with protein arrays. Predicted and matching interactions are shown in green.
More information | | Antibody specificity analysis with protein arrays. Predicted and matching interactions are shown in green.
More information | | Antibody specificity analysis with protein arrays. Predicted and matching interactions are shown in green.
More information | | Application not done for this antibody. | |
Antibody dilution |
1:500 | | 1:3000 | | 1:30000 | | 1:3000 | | | |
Validation PA |
Supportive: Pass with single peak corresponding to interaction only with its own antigen. | | Supportive: Pass with single peak corresponding to interaction only with its own antigen. | | Uncertain: Pass with quality comment low specificity (binding to 1-2 PrESTs >15% and <40%). | | Uncertain: Pass with quality comment low specificity (binding to 1-2 PrESTs >15% and <40%). | | | |
| |