The antibody and antigen information page lists the antigens and corresponding antibodies that have been used in the Human Protein Atlas project, together with the validation results for the antibodies.
In-house generated antibodies have the prefix "HPA". Antibodies provided by external distributors have the prefix "CAB". Links to providers for the antibodies are listed under antibody information, as well as the product name of the antibody as given by the provider.
The host species and the clonality (pAb = polyclonal, mAb = monoclonal, msAb = monospecific) of the antibody,
as well as the purification method is reported. The Human Protein Atlas version in which the antibody was first released is given.
The antigen type, length (amino acid residues), and sequence is reported (if available) under antigen
information. The percent identity (if >=80%) of the antigen sequence to the different proteins encoded by this gene,
and a link to the corresponding protein on the
Ensembl
website are listed. Any matches with >=80% sequence identity to proteins from other
Ensembl human genes are reported as "Other gene match" together with a link to that gene in the Human Protein Atlas and the maximum sequence identity (%) of the antigen to the matched protein(s) encoded by that gene.
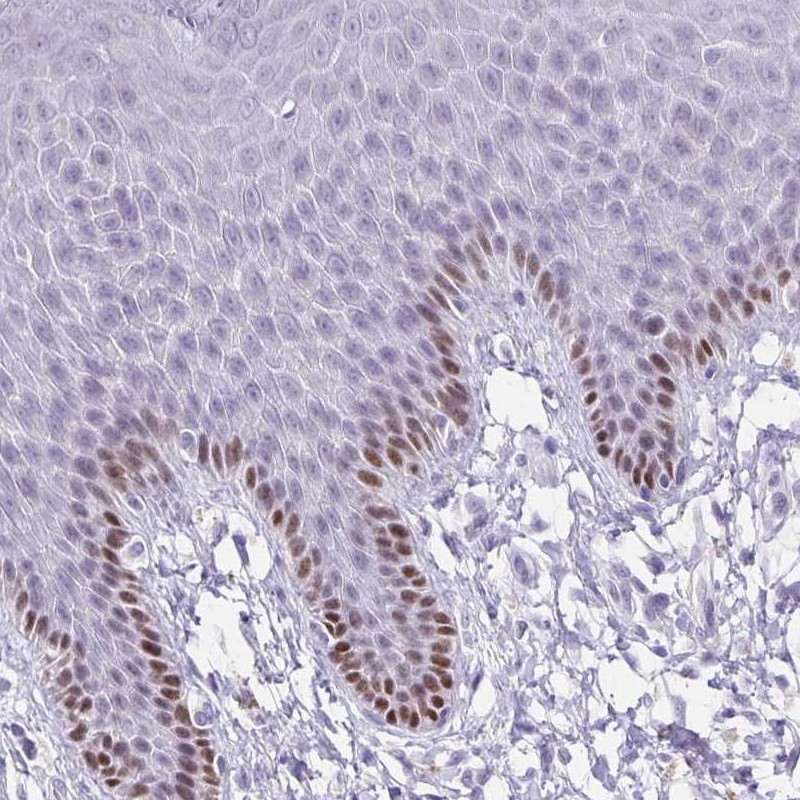
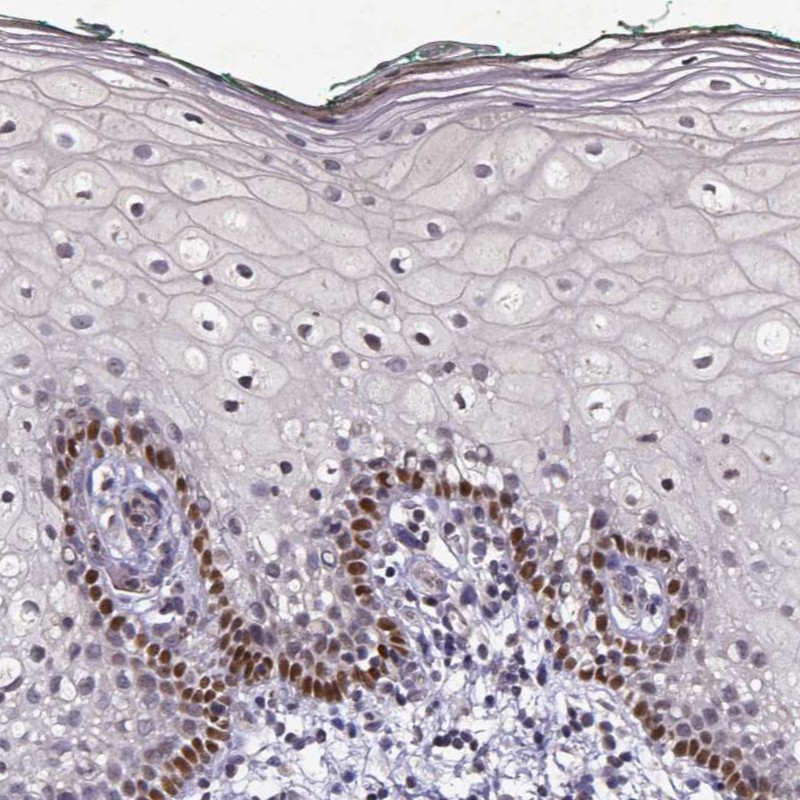
The antibody validation section reports the results from different assays. For immunohistochemistry, the image shown is a selected tissue with representative staining
for this antibody.
This image is clickable for enlarged view. Images from all tissues analysed using this antibody are found by clicking any tissue under the Normal
tissue heading found to the left in the TISSUE subatlas tab, and correspondingly by clicking any
cancer type under the Cancer tissue headings in the menu to the left in the CANCER subatlas tab.
There is also a short summary describing the observed staining patterns using this antibody for immunohistochemistry in a panel of human tissues
(see
annotation). The validation scoring of the antibody is described
here.
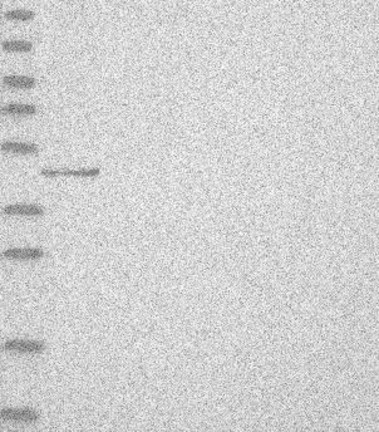
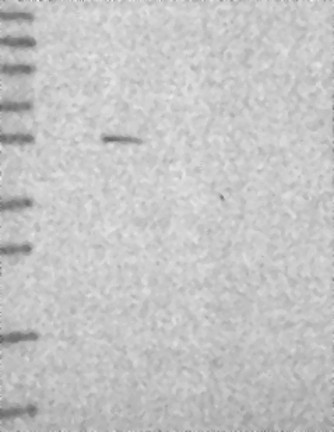
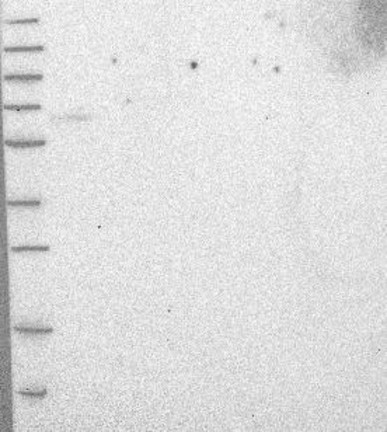
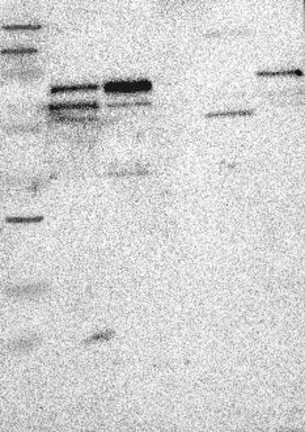
For Western blot, the images for supportive and uncertain validations are shown (
validation description), and the different lanes are described (
WB description). The image is clickable for enlarged view. The expected target mass for the targeted proteins is also listed.
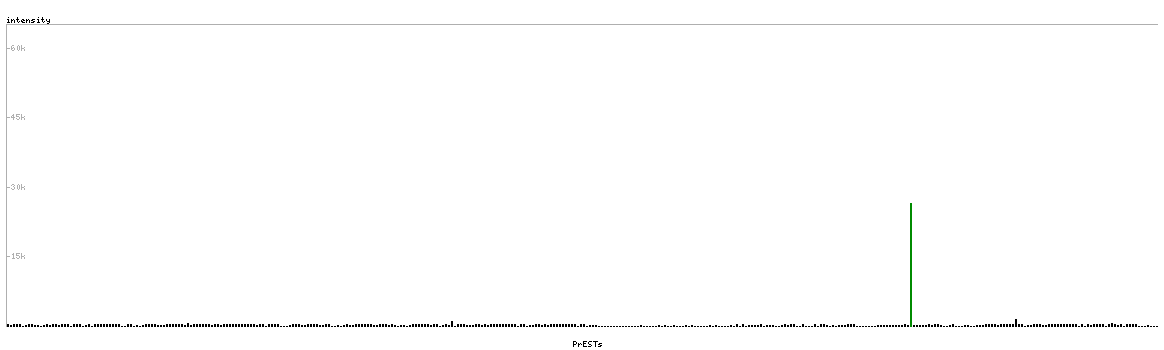
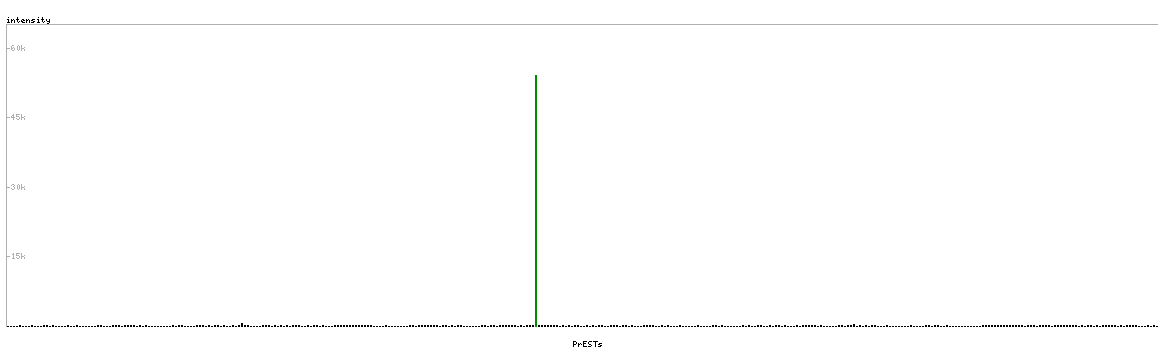
For in-house generated (HPA) antibodies, a protein array assay is performed. The image is a diagram showing the
specificity analysis using a number of different Protein Epitope Signature Tags (PrESTs), including the target PrEST (marked in green). The validation is described
here.
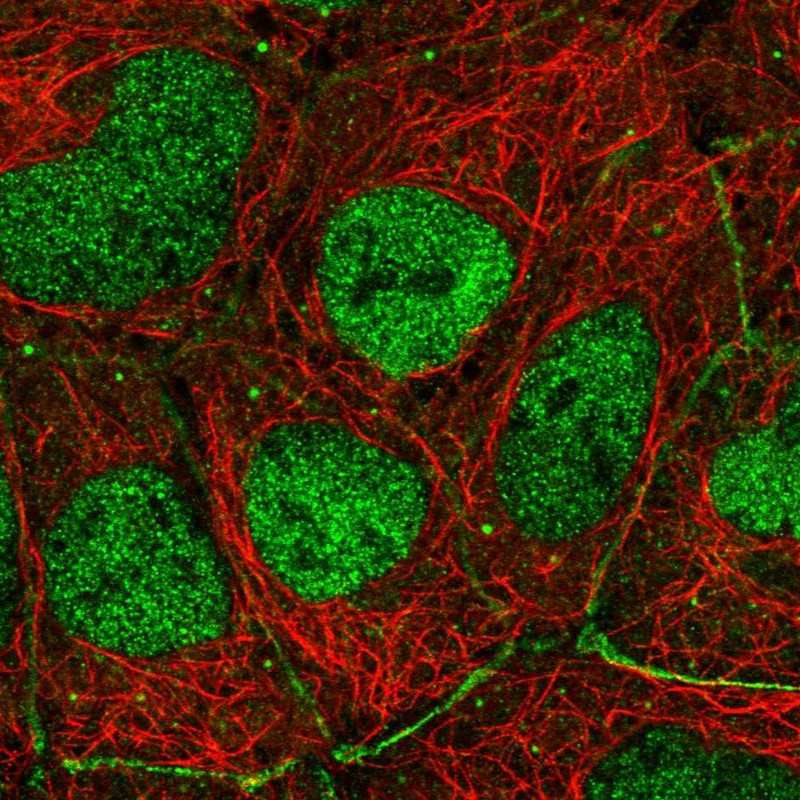
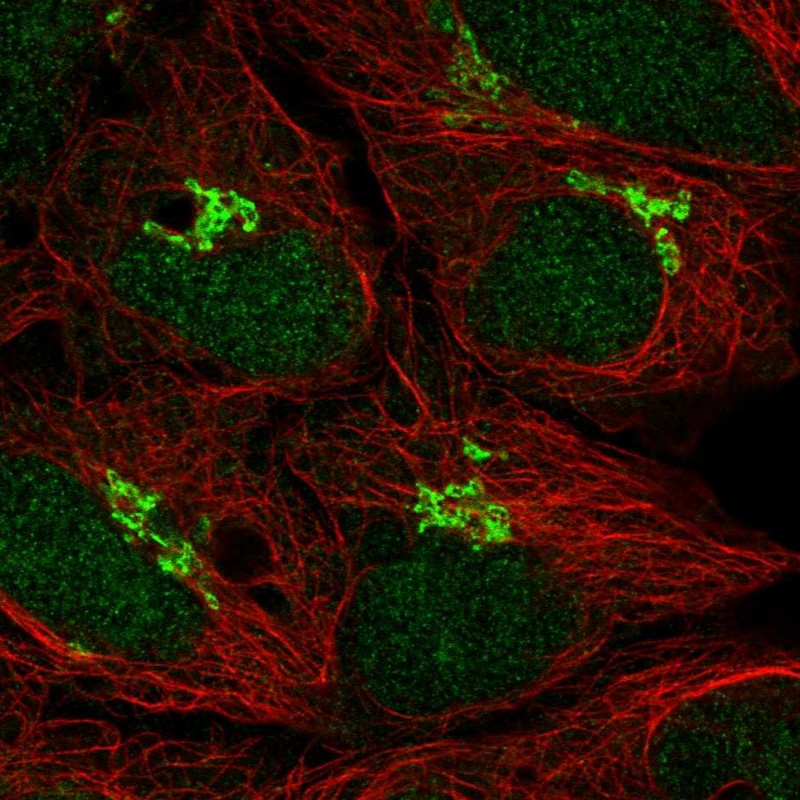
For the subcellular analysis using immunoflourescence, a representative image from the validation is shown, together with a summary of the staining.
The validation is described
here.