|
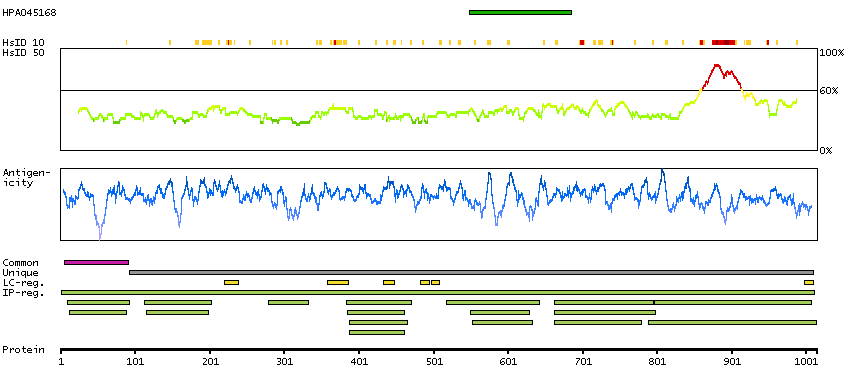
Antibody HPA045168
|
|
Antibody CAB000147
|
|
Antibody CAB003839
|
|
Antibody CAB003840
|
|
Antibody CAB075726
|
|
Antibody CAB075727
|
|
|
ANTIBODY INFORMATION
|
|
Provider |
Atlas Antibodies
Sigma-Aldrich
| | Promega
| | Epitomics
| | Epitomics
| | Atlas Antibodies
Sigma-Aldrich
| | Atlas Antibodies
Sigma-Aldrich
| |
Product name |
HPA045168 | | G7341 | | 1051-1 | | 1072-1 | | AMAb90959 | | AMAb90960 | |
Host species |
Rabbit | | Rabbit | | Rabbit | | Rabbit | | Mouse | | Mouse | |
Clonality |
pAb | | pAb | | mAb | | mAb | | mAb | | mAb | |
Purity |
Affinity purified using the PrEST-antigen as affinity ligand | | Not known | | Supernatant | | Supernatant | | Protein A/G | | Protein A/G | |
Released in version |
10 | | 1 | | 2 | | 2 | | 14 | | 14 | |
|
ANTIGEN INFORMATION
|
|
Antigen |
Recombinant protein fragment | | Not known | | Synthetic peptide | | Synthetic peptide | | Recombinant protein | | Recombinant protein | |
Length (aa) |
139 | | | | | | | | | | | |
Antigen sequence |
KGGKVFSATLGLVDIVKGTNSYYKLQLLEDDKENRYWIFRSWGRVGTVIG
SNKLEQMPSKEDAIEHFMKLYEEKTGNAWHSKNFTKYPKKFYPLEIDYGQ
DEEAVKKLTVNPGTKSKLPKPVQDLIKMIFDVESMKKAM
| |
| |
| |
| |
| |
| |
Matching transcripts |
PARP1-001 - ENSP00000355759 [100%]
| | | | | | | | | | | |
Other gene match |
| | | | | | | | | | | |
|
ANTIBODY VALIDATION
|
|
|
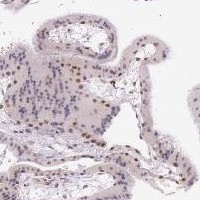
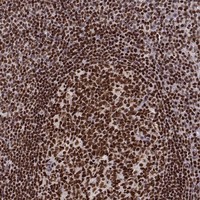
Immunohistochemistry
|
|
Image |
 | |  | |  | |  | |  | |  | |
Description |
Immunohistochemical staining of human cerebellum shows strong nuclear positivity in Purkinje cells.
More information | | Immunohistochemical staining of human placenta shows moderate nuclear positivity in trophoblastic cells.
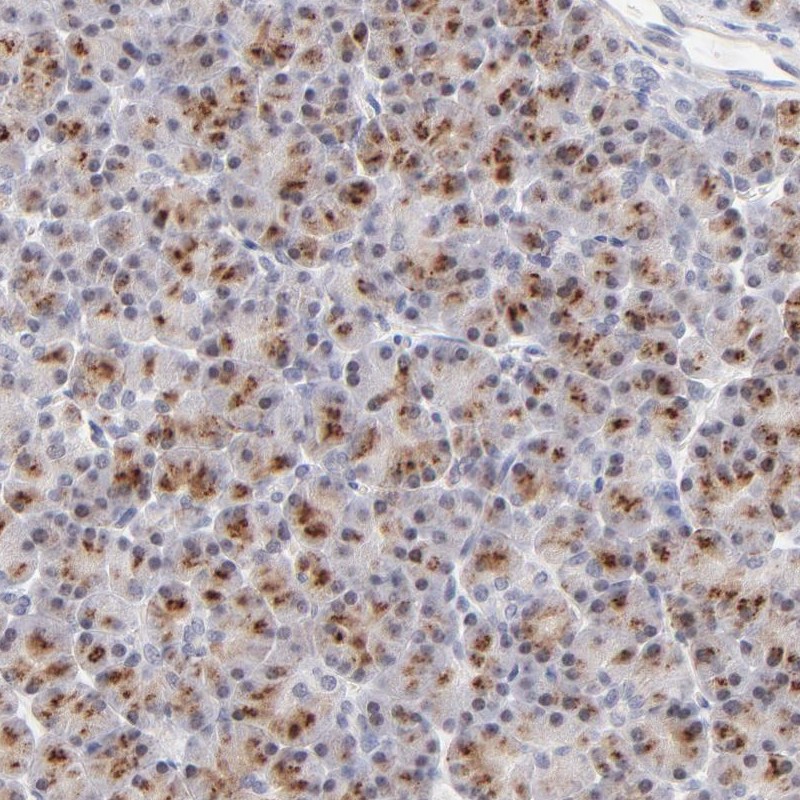
More information | | Immunohistochemical staining of human pancreas shows strong cytoplasmic positivity, with a granular pattern, in exocrine glandular cells.
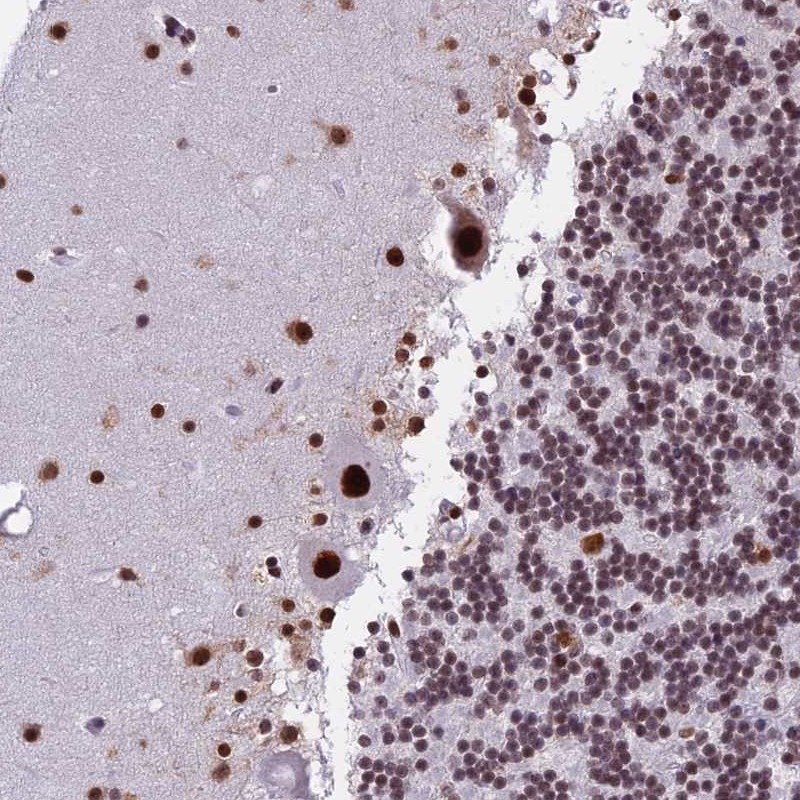
More information | | Immunohistochemical staining of human cerebellum shows strong nuclear positivity in Purkinje cells, cells in molecular layer
More information | | Immunohistochemical staining of human tonsil shows strong nuclear positivity in germinal center cells and non-germinal center cells.
More information | | Immunohistochemical staining of human tonsil shows strong positivity in germinal center cells and non-germinal center cells.
More information | |
Retrieval method |
HIER pH6 | | HIER pH6 | | HIER pH6 | | HIER pH6 | | HIER pH6 | | HIER pH6 | |
Antibody dilution |
1:1200 | | 1:200 | | 1:100 | | 1:25 | | 1:1500 | | 1:40000 | |
Literature conformity |
Consistent with extensive gene/protein characterization data | | Partly consistent with extensive gene/protein characterization data | | Partly consistent with extensive gene/protein characterization data | | Consistent with extensive gene/protein characterization data | | Consistent with extensive gene/protein characterization data | | Consistent with extensive gene/protein characterization data | |
RNA consistency |
Consistent with RNA expression data | | Mainly not consistent with RNA expression data | | Mainly not consistent with RNA expression data | | Consistent with RNA expression data | | Consistent with RNA expression data | | Consistent with RNA expression data | |
|
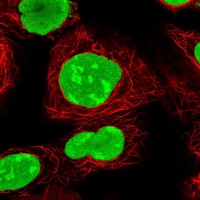
Immunofluorescence
|
|
Image |
 | | | |  | |  | | | | | |
Description |
Immunofluorescent staining of human cell line HEK 293 shows positivity in nucleus.
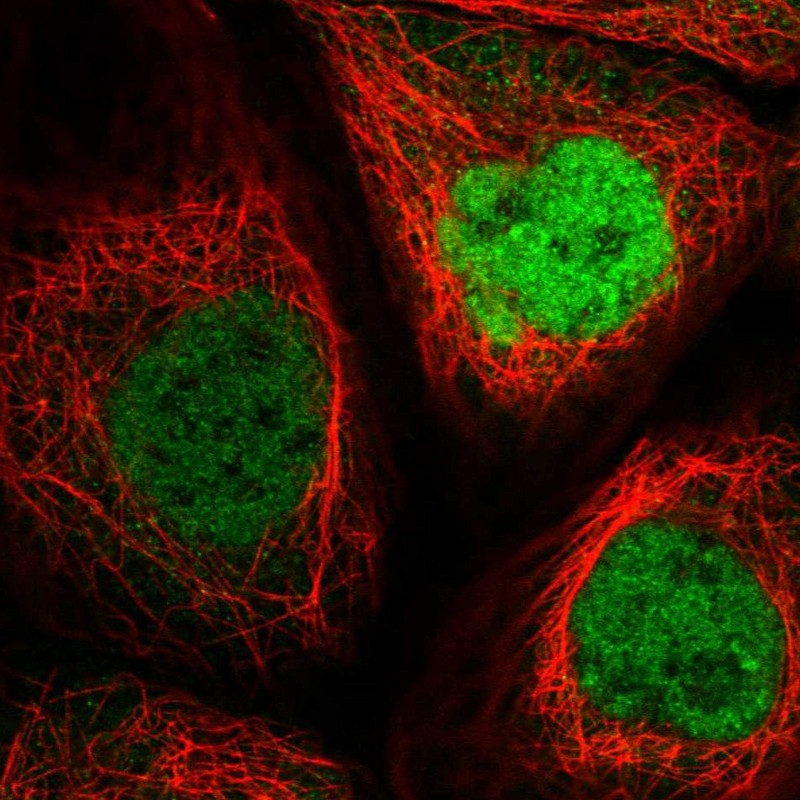
More information | | Application not done for this antibody. | | Immunofluorescent staining of human cell line A-431 shows positivity in nucleus but excluded from the nucleoli.
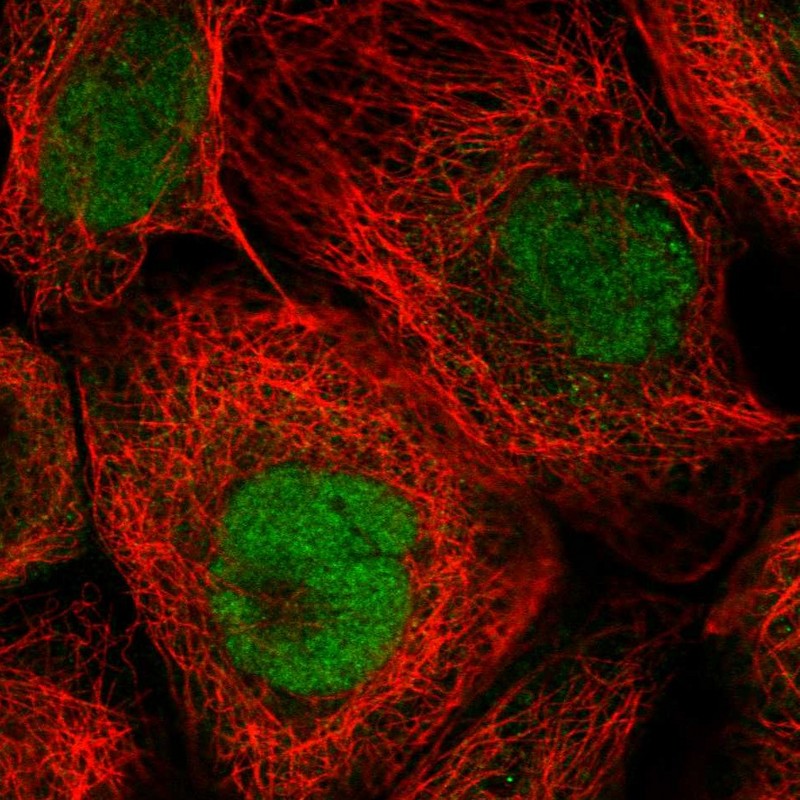
More information | | Immunofluorescent staining of human cell line A-431 shows positivity in nucleus.
More information | | Application not done for this antibody. | | Application not done for this antibody. | |
Antibody dilution |
1:81 | | | | 1:25 | | 1:6 | | | | | |
Validation IF |
Supportive: The subcellular location is supported by experimental gene/protein characterization data, gene silencing, or an independent antibody. | | | | Supportive: The subcellular location is supported by experimental gene/protein characterization data, gene silencing, or an independent antibody. | | Supportive: The subcellular location is supported by experimental gene/protein characterization data, gene silencing, or an independent antibody. | | | | | |
|
siRNA
|
|
Image |
 | | | | | | | | | | | |
Description |
Signal downregulation > 25% by one siRNA.
More information | | Application not done for this antibody. | | Application not done for this antibody. | | Application not done for this antibody. | | Application not done for this antibody. | | Application not done for this antibody. | |
Antibody dilution |
1:81 | | | | | | | | | | | |
Validation siRNA |
Supportive: The siRNA validation is supportive. | | | | | | | | | | | |
|
Western blot - siRNA
|
|
Image |
 | | | | | | | | | | | |
Description |
Lane 1: Marker [kDa] 250, 130, 95, 72, 55, 36, 28, 17, 10
Lane 2: siRNA 1
Lane 3: siRNA 2
Lane 4: Scrambled
More information | | Application not done for this antibody. | | Application not done for this antibody. | | Application not done for this antibody. | | Application not done for this antibody. | | Application not done for this antibody. | |
Target mass (kDa) |
113.1 | | | | | | | | | | | |
Loading control |
Total protein image | | | | | | | | | | | |
Antibody dilution |
1:180 | | | | | | | | | | | |
Validation WB-siRNA |
Supportive: Downregulation visible in both siRNA lanes | | | | | | | | | | | |
|
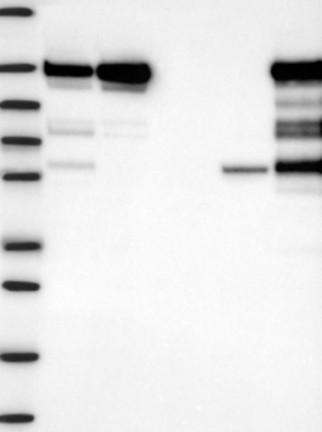
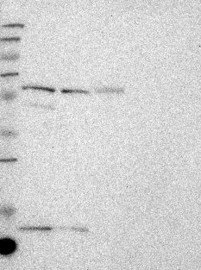
Western Blot
|
|
Image |
 | |  | | | | | |  | |  | |
Description |
Lane 1: Marker [kDa] 250, 130, 95, 72, 55, 36, 28, 17, 10
Lane 2: RT4
Lane 3: U-251 MG
Lane 4: Human Plasma
Lane 5: Liver
Lane 6: Tonsil
More information | | Lane 1: Marker [kDa] 250, 130, 95, 72, 55, 36, 28, 17, 11
Lane 2: RT4
Lane 3: U-251 MG
Lane 4: Human Plasma
Lane 5: Liver
Lane 6: Tonsil
More information | | | | | | Lane 1: Marker [kDa] 250, 130, 95, 72, 55, 36, 28, 17, 10
Lane 2: RT4
Lane 3: U-251 MG
Lane 4: Human Plasma
Lane 5: Liver
Lane 6: Tonsil
More information | | Lane 1: Marker [kDa] 250, 130, 95, 72, 55, 36, 28, 17, 10
Lane 2: RT4
Lane 3: U-251 MG
Lane 4: Human Plasma
Lane 5: Liver
Lane 6: Tonsil
More information | |
Target mass (kDa) |
113.1 | | 113.1, 17.3, 12.2 | | 113.1, 17.3, 12.2 | | 113.1, 17.3, 12.2 | | 113.1, 17.3, 12.2 | | 113.1, 17.3, 12.2 | |
Antibody dilution |
1:250 | | 1:500 | | 1:500 | | 1:500 | | 1:500 | | 1:500 | |
Validation WB |
Supportive: Band of predicted size in kDa (+/-20%) with additional bands present | | Supportive: Band of predicted size in kDa (+/-20%) with additional bands present | | Non-supportive: Only bands not corresponding to the predicted size | | Non-supportive: Only bands not corresponding to the predicted size | | Supportive: Band of predicted size in kDa (+/-20%) with additional bands present | | Supportive: Band of predicted size in kDa (+/-20%) with additional bands present | |
|
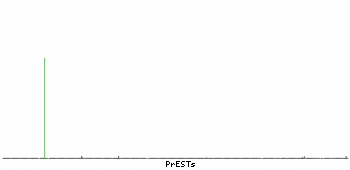
Protein array
|
|
Image |
 | | | | | | | | | | | |
Description |
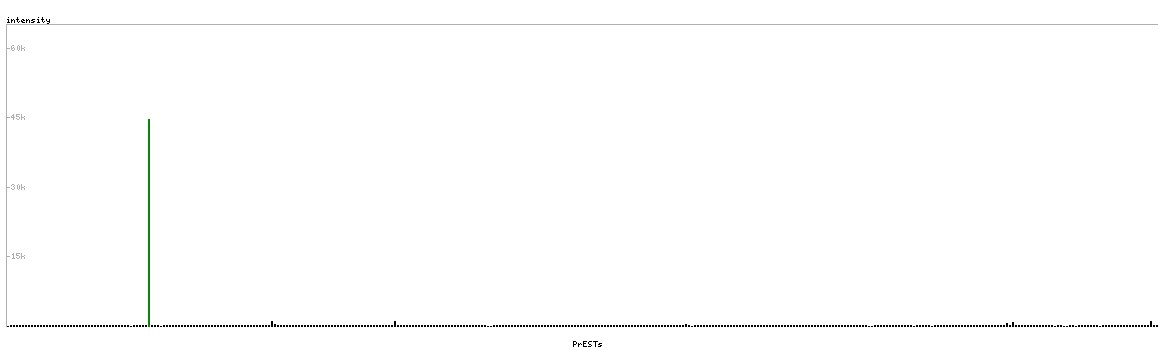
Antibody specificity analysis with protein arrays. Predicted and matching interactions are shown in green.
More information | | Application not done for this antibody. | | Application not done for this antibody. | | Application not done for this antibody. | | Application not done for this antibody. | | Application not done for this antibody. | |
Antibody dilution |
1:3000 | | | | | | | | | | | |
Validation PA |
Supportive: Pass with single peak corresponding to interaction only with its own antigen. | | | | | | | | | | | |
| |